Why should I create a boxplot from my data?
A boxplot provides a visual summary of the distribution of your data, including the median, quartiles, and potential outliers, allowing you to quickly grasp the central tendency and spread of your data.
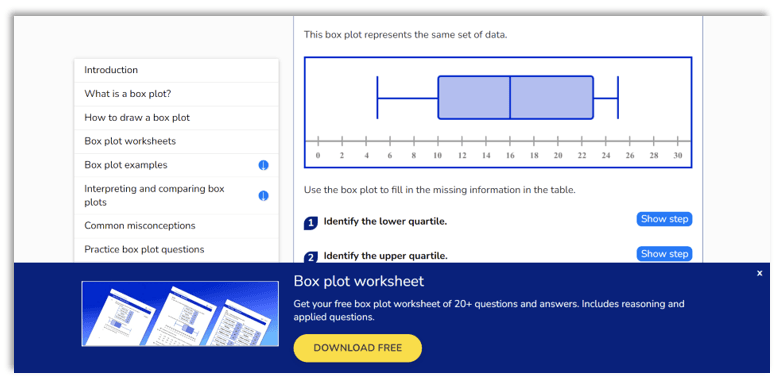
You can find great material on the subject on the internet, for example here:
https://thirdspacelearning.com/gcse-maths/statistics/box-plot/