Processing tools and plugins
Introduction
A key strength of GIS software like QGIS is its ability to process and analyze spatial data efficiently. In this lesson, we will explore the wide range of processing tools and plugins available in QGIS that allow you to work with both vector and raster data.
The Processing Toolbox is a central feature of QGIS, offering hundreds of built-in algorithms for tasks such as spatial analysis, geoprocessing, raster calculations, and data conversion. Additionally, plugins extend the functionality of QGIS even further by adding specialized tools developed by the GIS community.
By the end of this lesson, you will:
✅ Understand how to access and navigate the Processing Toolbox in QGIS.
✅ Learn the basic processing tools for vector data (e.g., buffer, clip, dissolve, spatial joins).
✅ Discover the essential processing tools for raster data (e.g., reclassification, raster calculator, hillshade analysis).
✅ Explore how to install and manage plugins to enhance your QGIS capabilities.
✅ Apply a selection of processing tools and plugins.
Get ready to unlock the full power of QGIS through processing tools and community-driven plugins!
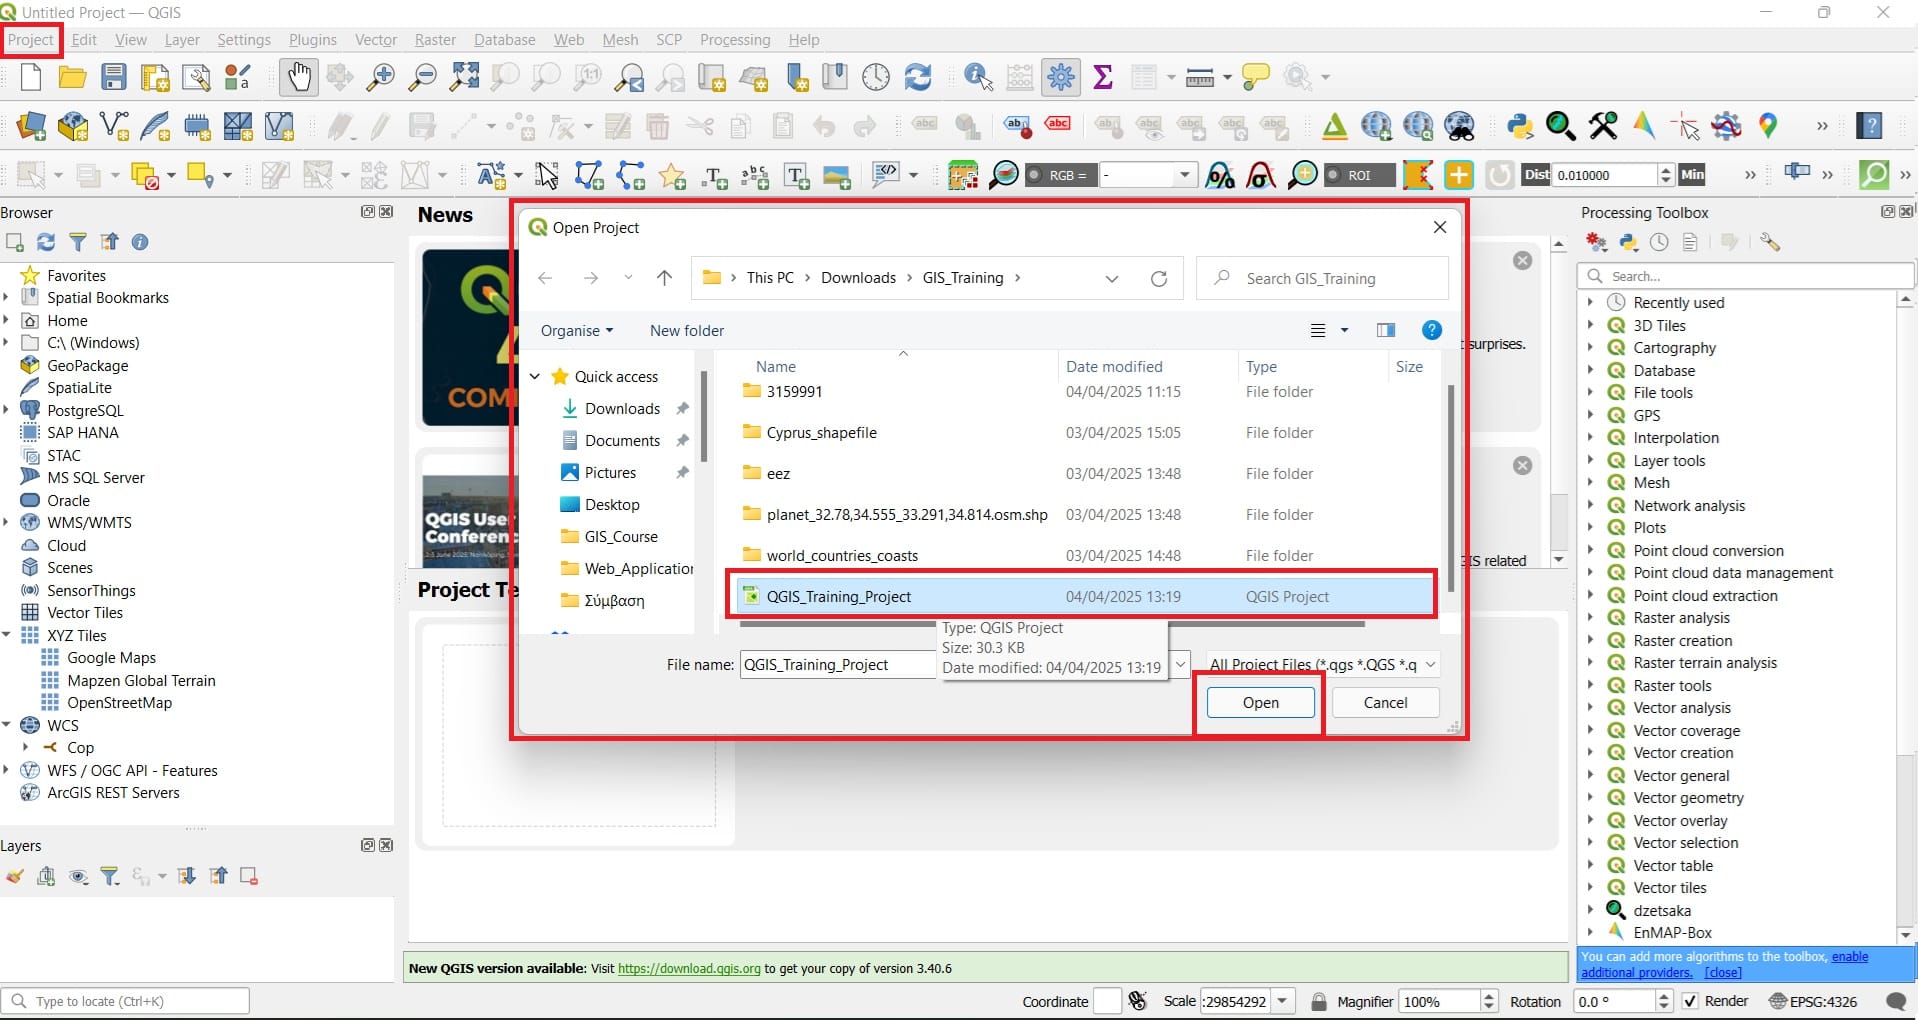
Step 1: Let’s open QGIS Platform and load our saved project ‘QGIS_Training_Project’ from the previous lesson.
Press ‘Project’ > ‘Open’ > Navigate to the folder you created with all data from Cyprus and load > ‘QGIS_Training_Project’ file (.qgz file) > Press ‘Open’
Step 2: Exploring QGIS functionalities
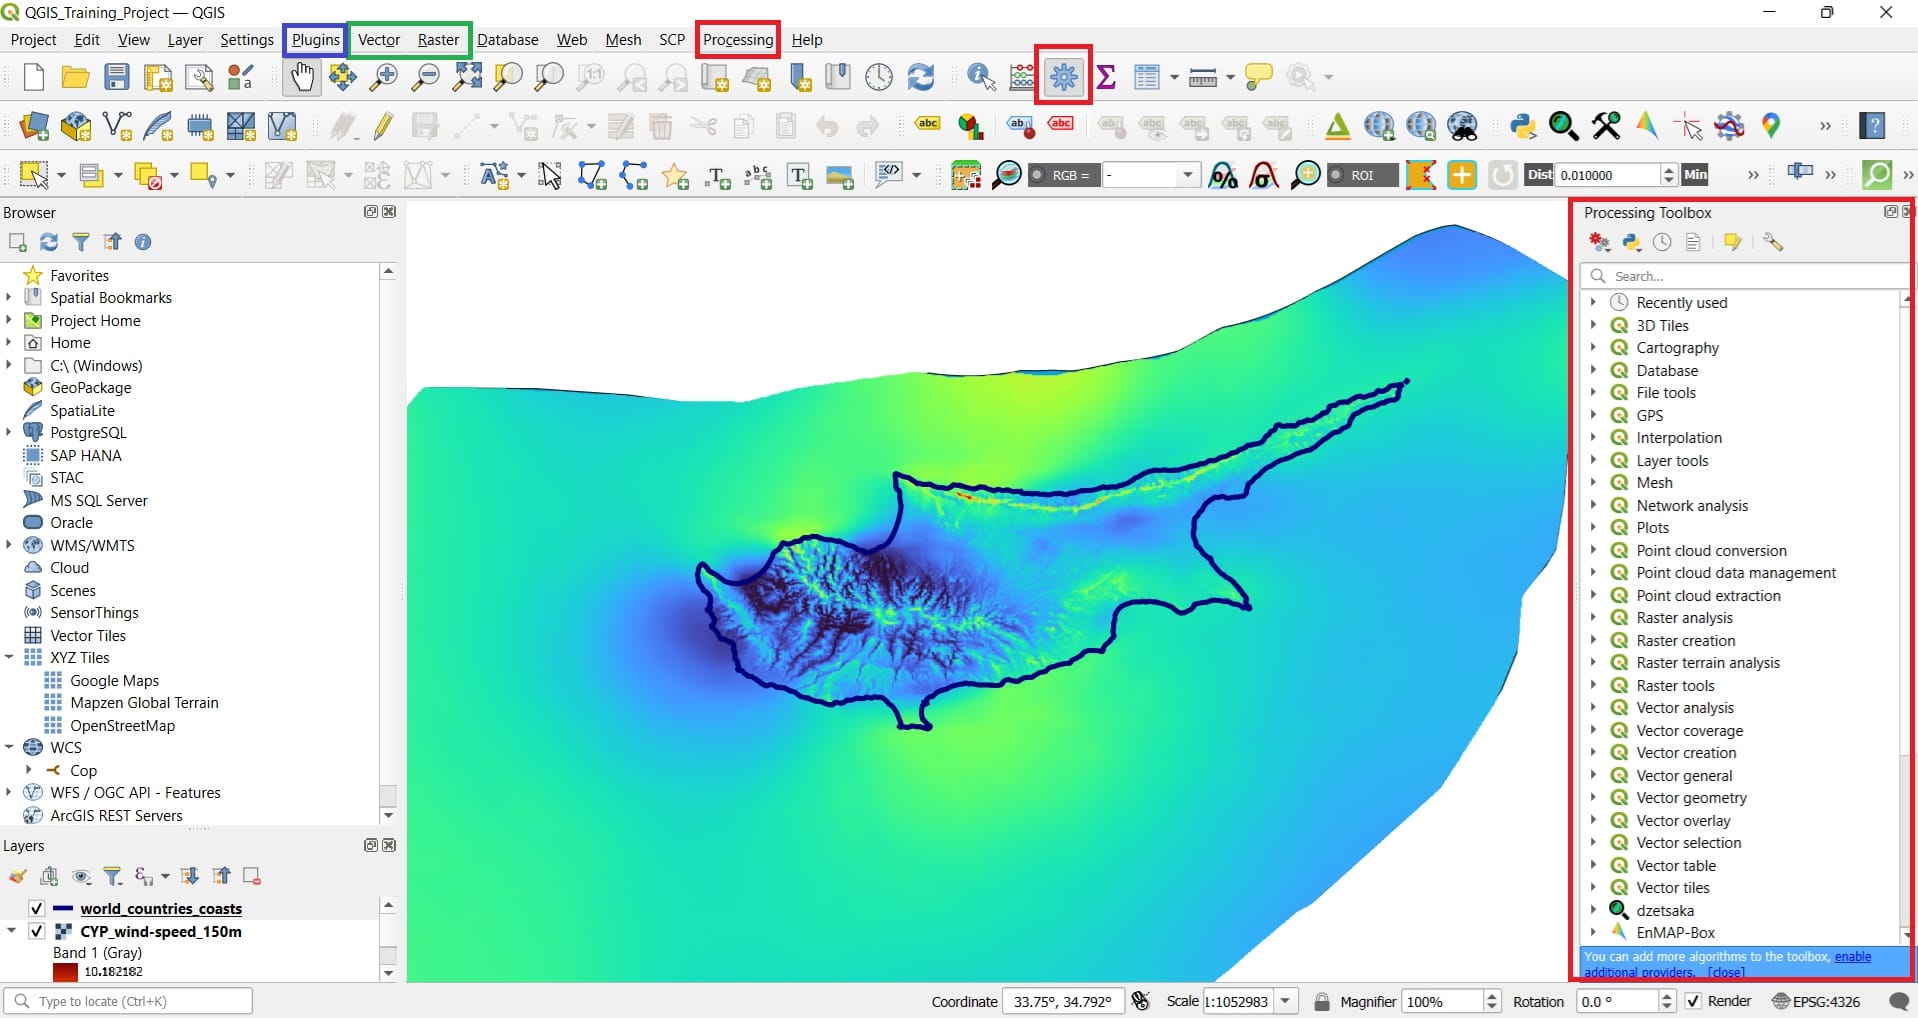
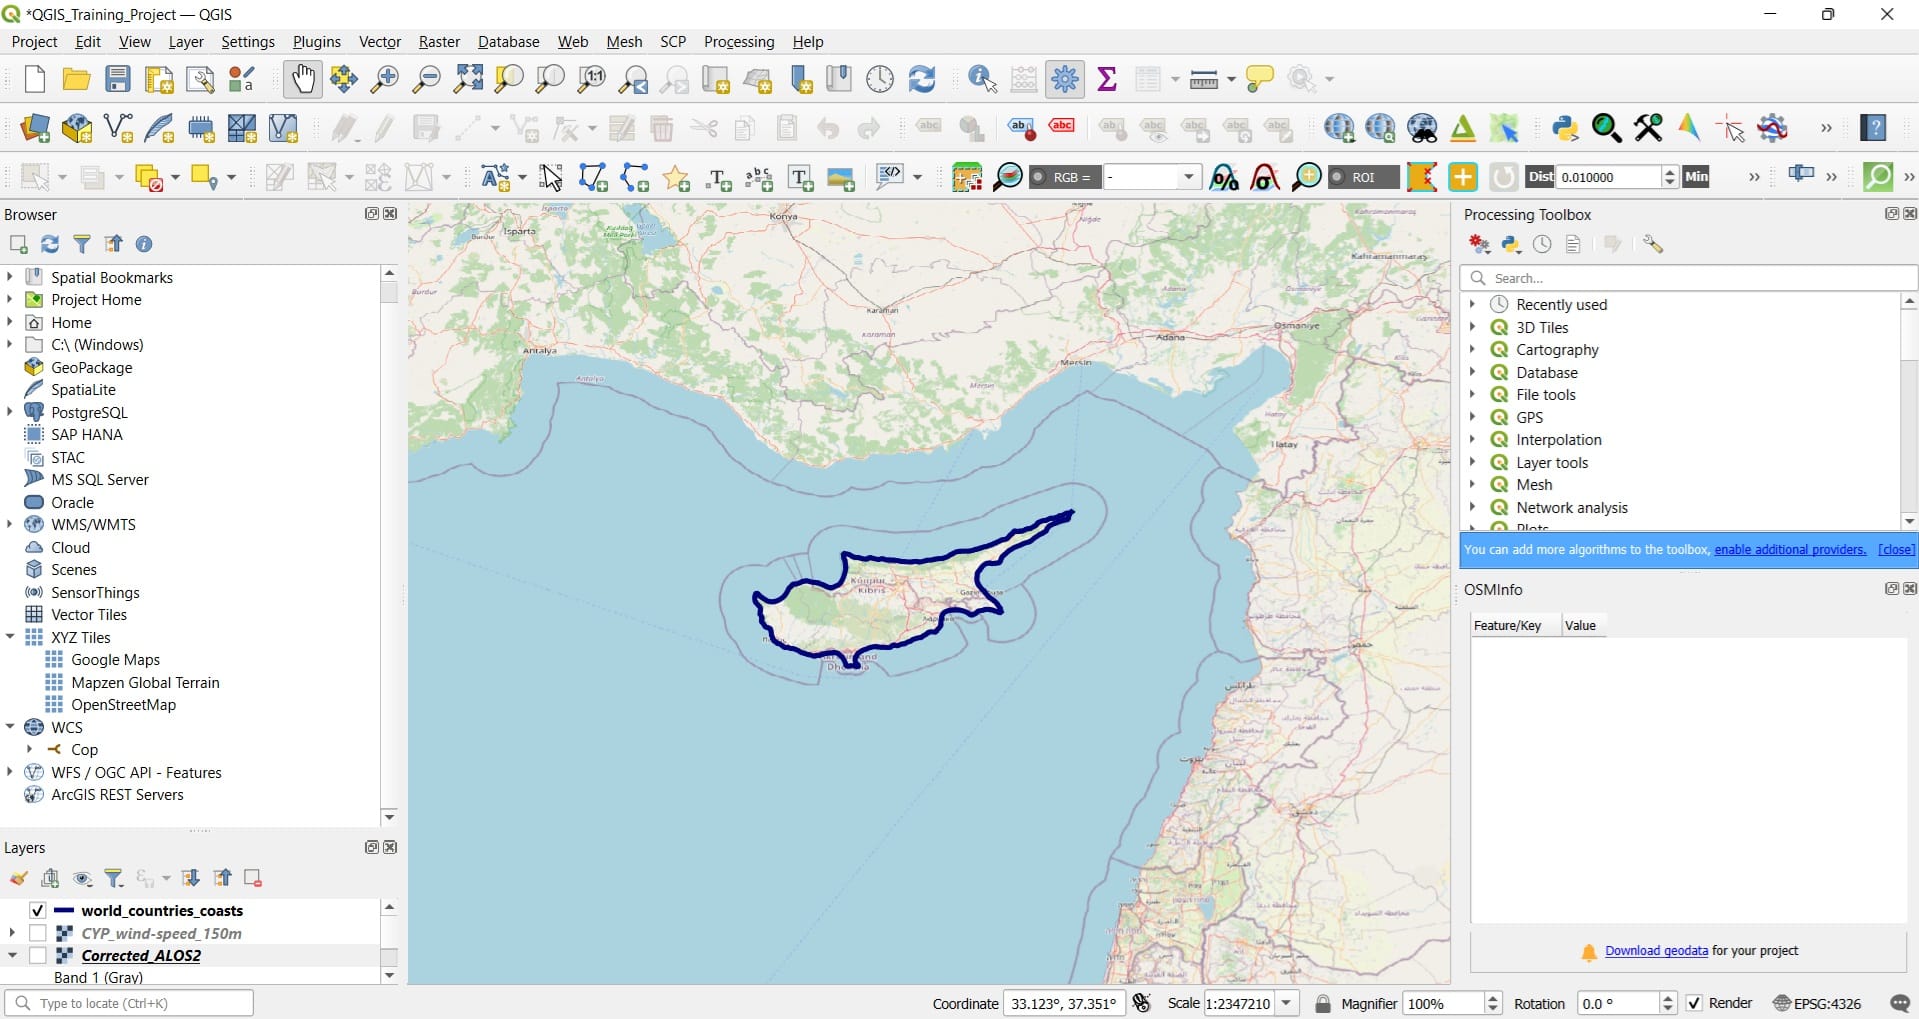
🟥 Red Boxes
The red boxes highlight the Processing tools environment in QGIS:
- Processing Menu (Top Menu Bar):
This menu provides access to QGIS’s full set of processing algorithms for both vector and raster data, model building, and batch processing. - Processing Toolbox (Right Sidebar):
This is the main panel where you can browse, search, and run a wide variety of algorithms. It is organized into categories such as:- Raster analysis and Vector analysis
- Cartography
- 3D and vector tiles
- GPS and more
➔ You can also enable additional algorithm providers to extend the toolbox’s capabilities.
- Gear Icon (Processing Toolbox Shortcut Button):
A shortcut button to quickly open or hide the Processing Toolbox for easy access during your work.
🟦 Blue Box
The blue box highlights the Plugins Menu:
-
Plugins Menu (Top Menu Bar):
From here, you can install, update, activate, or deactivate plugins. Plugins extend QGIS’s functionality, adding specialized tools for tasks like web mapping, 3D visualization, advanced analysis, data import/export, and more.
➔ Installing the right plugins can greatly enhance your QGIS experience and adapt the platform to your specific project needs.
🟩 Green Box
The green box highlights the Vector and Raster tools menus (during our next course, we will further explore these processing tools!):
-
Vector Menu (Top Menu Bar):
Provides direct access to pre-installed tools for vector data processing, such as:- Buffer creation (create bufffer zones around point, line or polygon data)
- Spatial joins (join feature values from different datasets based on their relative spatial locations)
- Intersection, clip and union of geometries (merge, clip or intersect spatial data)
- Geometry editing and cleaning (digitize point, line or polygon features)
-
Raster Menu (Top Menu Bar):
Offers access to built-in tools for raster data processing, including:- Raster calculator (use mathematical expressions for raster data, i.e. pixel-by-pixel calculations)
- Raster reclassification (change raster data scales/classes)
- Extraction of values (mask raster data)
- Terrain analysis (calculate slope, aspect, or the hillshade from Digital Elevation Models – DEM)
- Conversion tools (convert raster data to vector and the opposite)
These menus allow you to perform common spatial tasks without needing to open the full Processing Toolbox or install any extra plugins.
📌 Summary
- 🟥 Red boxes → Highlight the Processing Toolbox and processing environment including all pre-installed tools.
- 🟩 Green box → Highlights Vector and Raster menus offering built-in tools for basic spatial analysis.
- 🟦 Blue box → Highlights the Plugins menu for extending QGIS functionalities.
Step 3: Exploring Plugins functionalities
Plugins in QGIS add useful features to the software. Plugins are written by QGIS developers and other independent users who want to extend the core functionality of the software. These plugins are made available in QGIS for all the users and a detailed list can be found here.
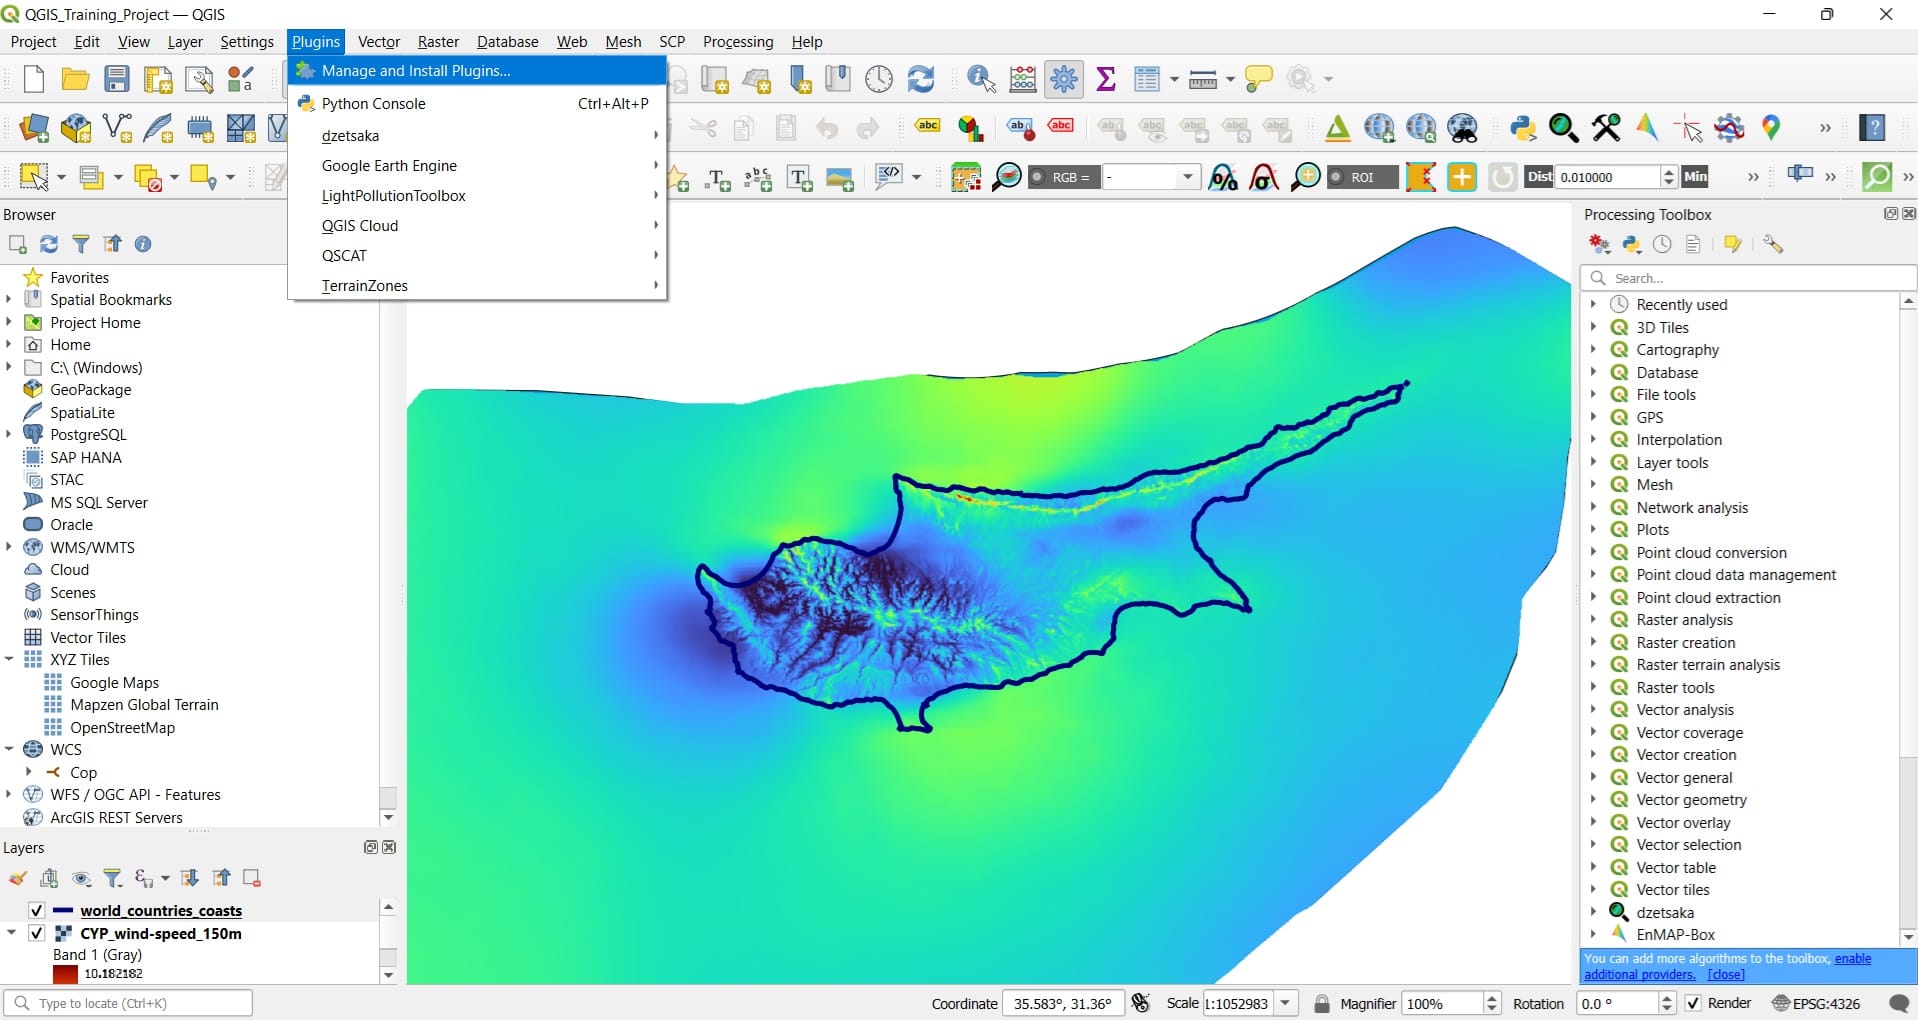
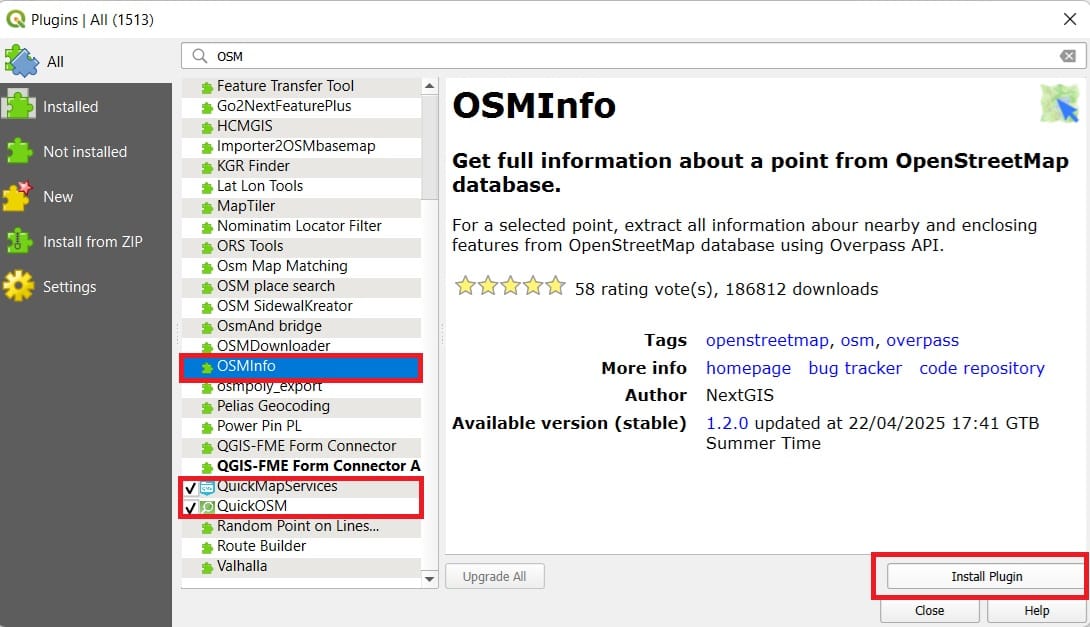
To begin using plugins, you need to know how to download, install and activate them. To do this, you will learn how to use the Plugin Installer and Plugin Manager. Navigate to the QGIS main toolbar and select ‘Plugins’ > ‘Manage and Install Plugins’.
A new window will pop-up including All Plugins, plugins already installed in QGIS or plugins that have not been installed yet.
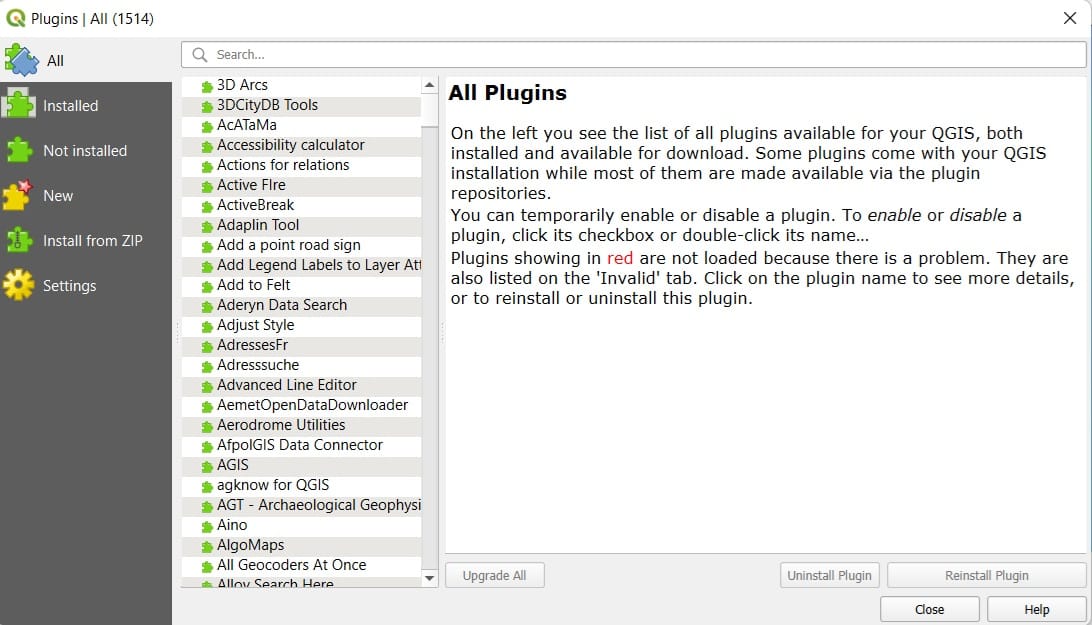
In order to install new plugins we can just use the ‘Search’ toolbar to identify specific plugins we are interested to. Let’s say that we want to install 2 plugins, one for loading Open Street Map (OSM) data and one for creating 3D surfaces!
If we search for ‘OSM’ we may find different plugins related to Open Street Map (OSM). We will install 3 different plugins entitled as ‘OSMinfo’, ‘QuickMapServices’ and ‘QuickOSM’. We just selct each one of them and then we press ‘Install plugin’. That was it! Our plugins have been installed.
All plugins related to OSM can be found on the QGIS main toolbar > Web (see image below). Why there? Because we are exploring and loading data from different web services, similarly to the OGC services (WMS or WFS we used in the previous lesson) however, now it’s easier since different QGIS users created those plugins to make our life easier! Let’s try to load an OSM basemap!
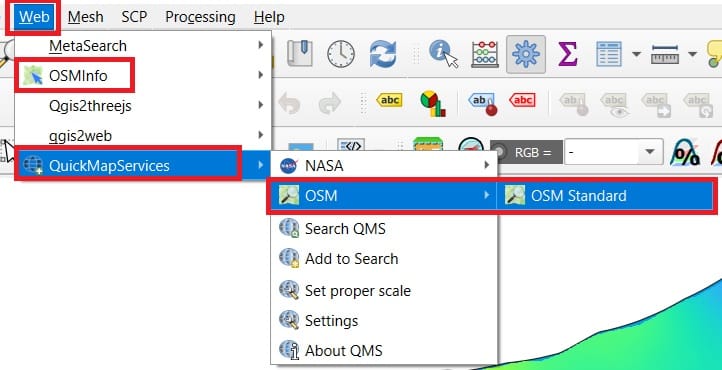
We press ‘Web’ > ‘QuickMapServices’ > ‘OSM’ > ‘OSM Standard’ and our basemap will load in a few seconds.
We can zoom-in in Cyprus, for example, in the broader Limassol area (see image below) and now, we can use the second plugin we’ve installed!
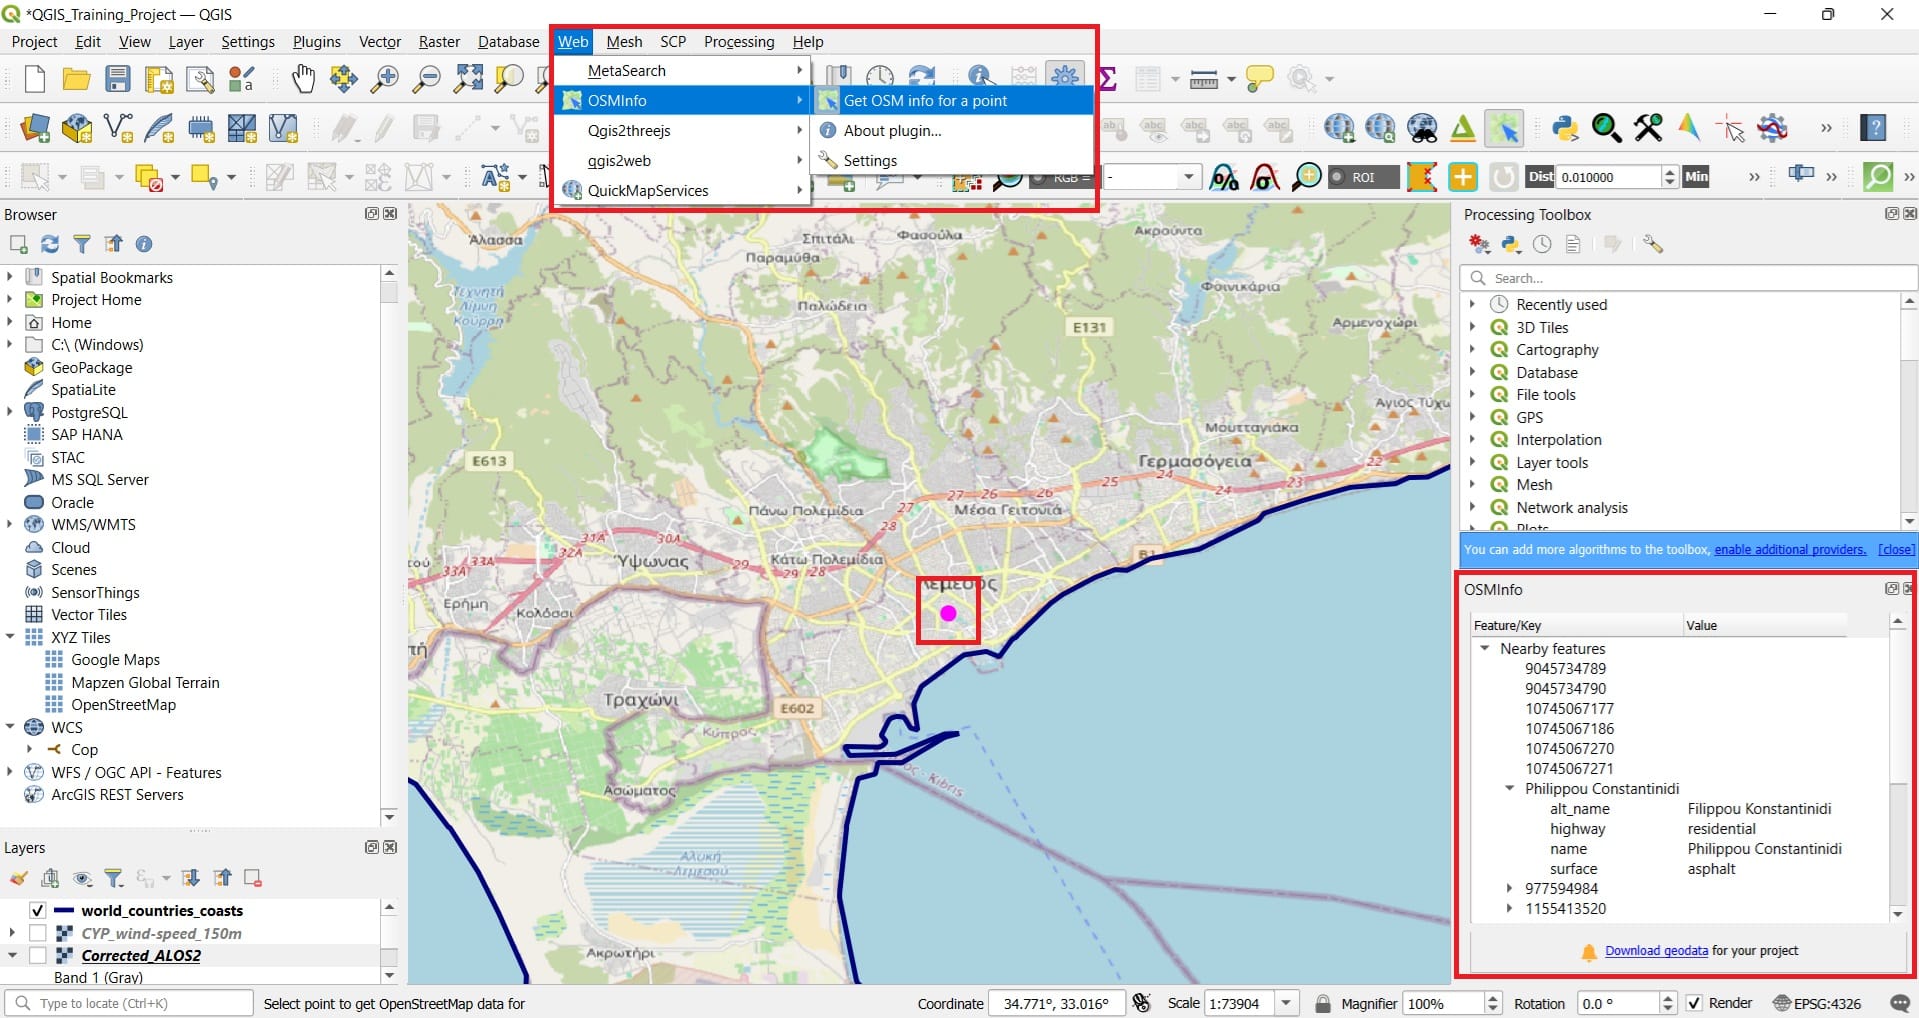
We navigate to the main toolbar again and we select ‘Web’ > ‘OSMinfo’ > ‘Get OSM info for a point’. Then we press to a random area in Limassol and a new window will appear on the bottom right area of QGIS, featuring all descriptive information for this point, for example, if it’s a road or a building, the name of the street, the regional unit it belongs etc.
Apart from the ‘Open Street Maps’ basemap, you can also load the ‘Aerial (Satellite)’ view. To do that, you just select ‘Web’ on the main QGIS Toolbar > ‘QuickMapServices’ > ‘Search QMS’ > a new window will appear on the bottom right corner of QGIS.
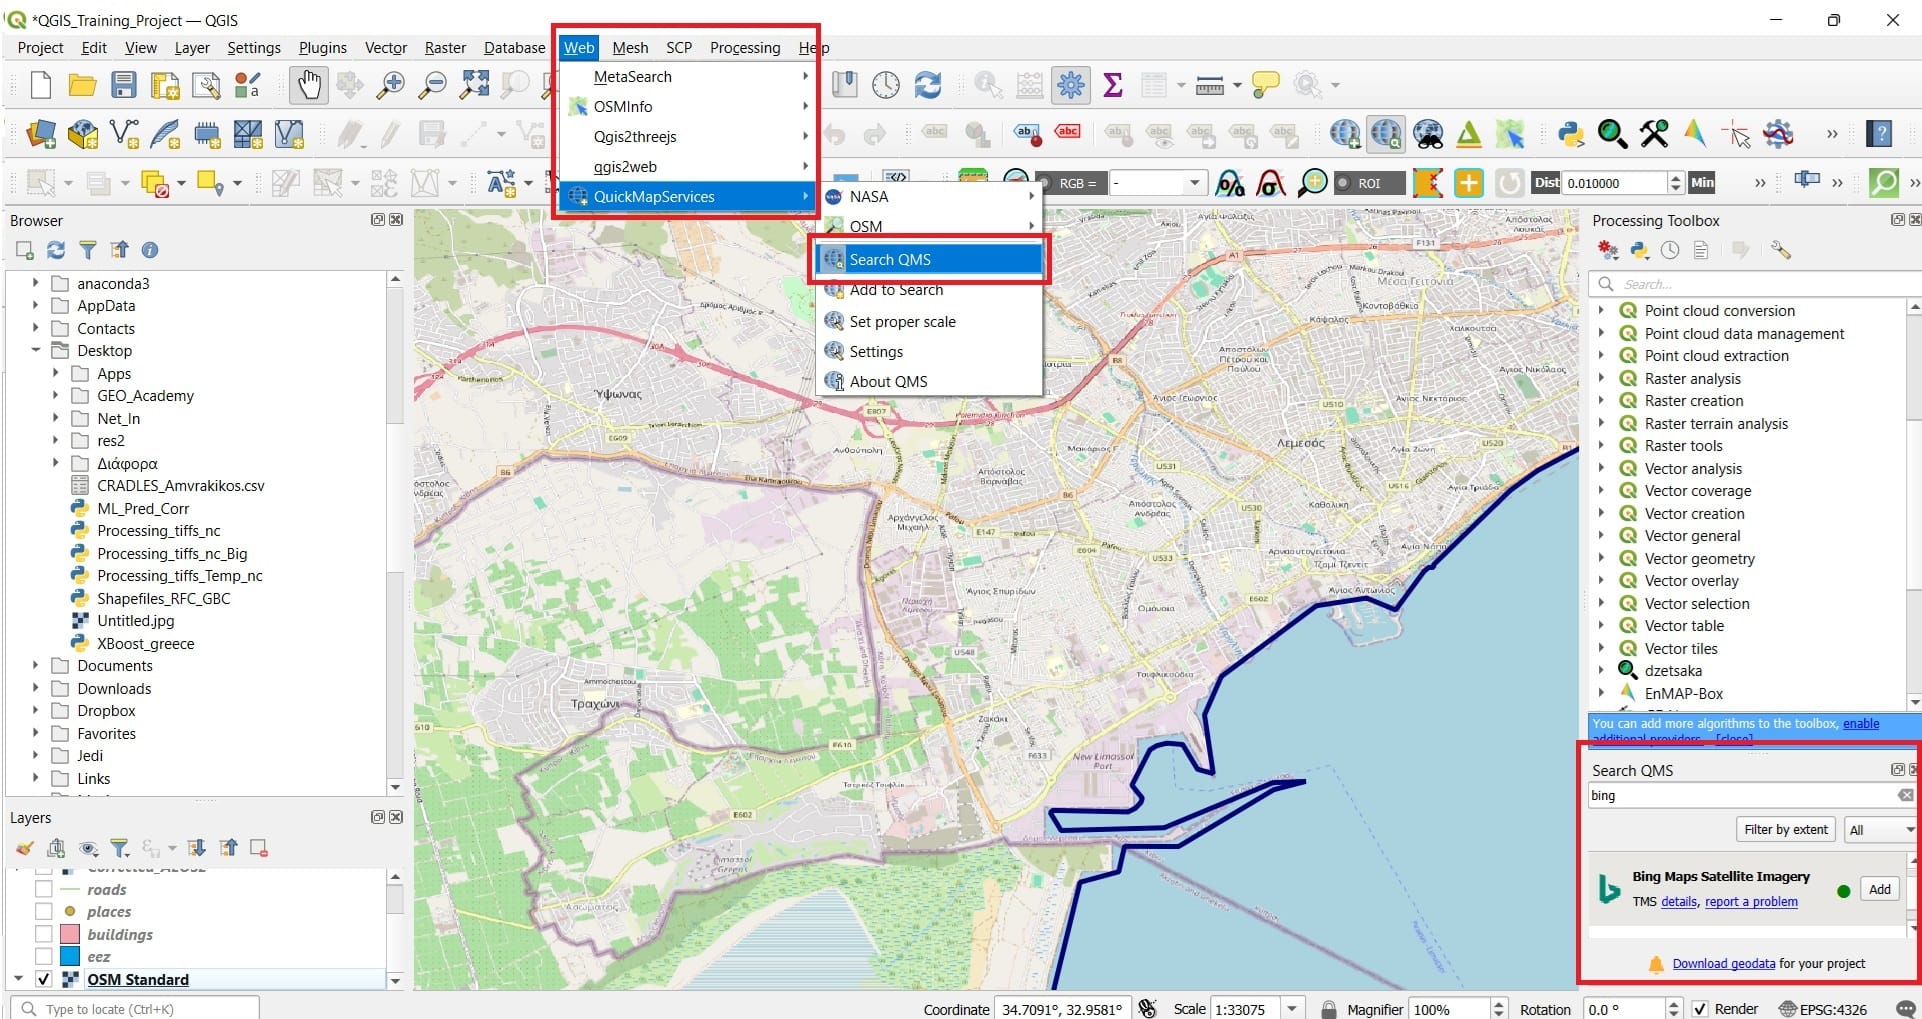
With the ‘Search QMS’ you may find different basemaps. Let’s try the ‘Bing Aerial Map’ by simply typing on the ‘Search QMS’ bar ‘bing’! Select any of the resulted basemaps and press ‘Add’.
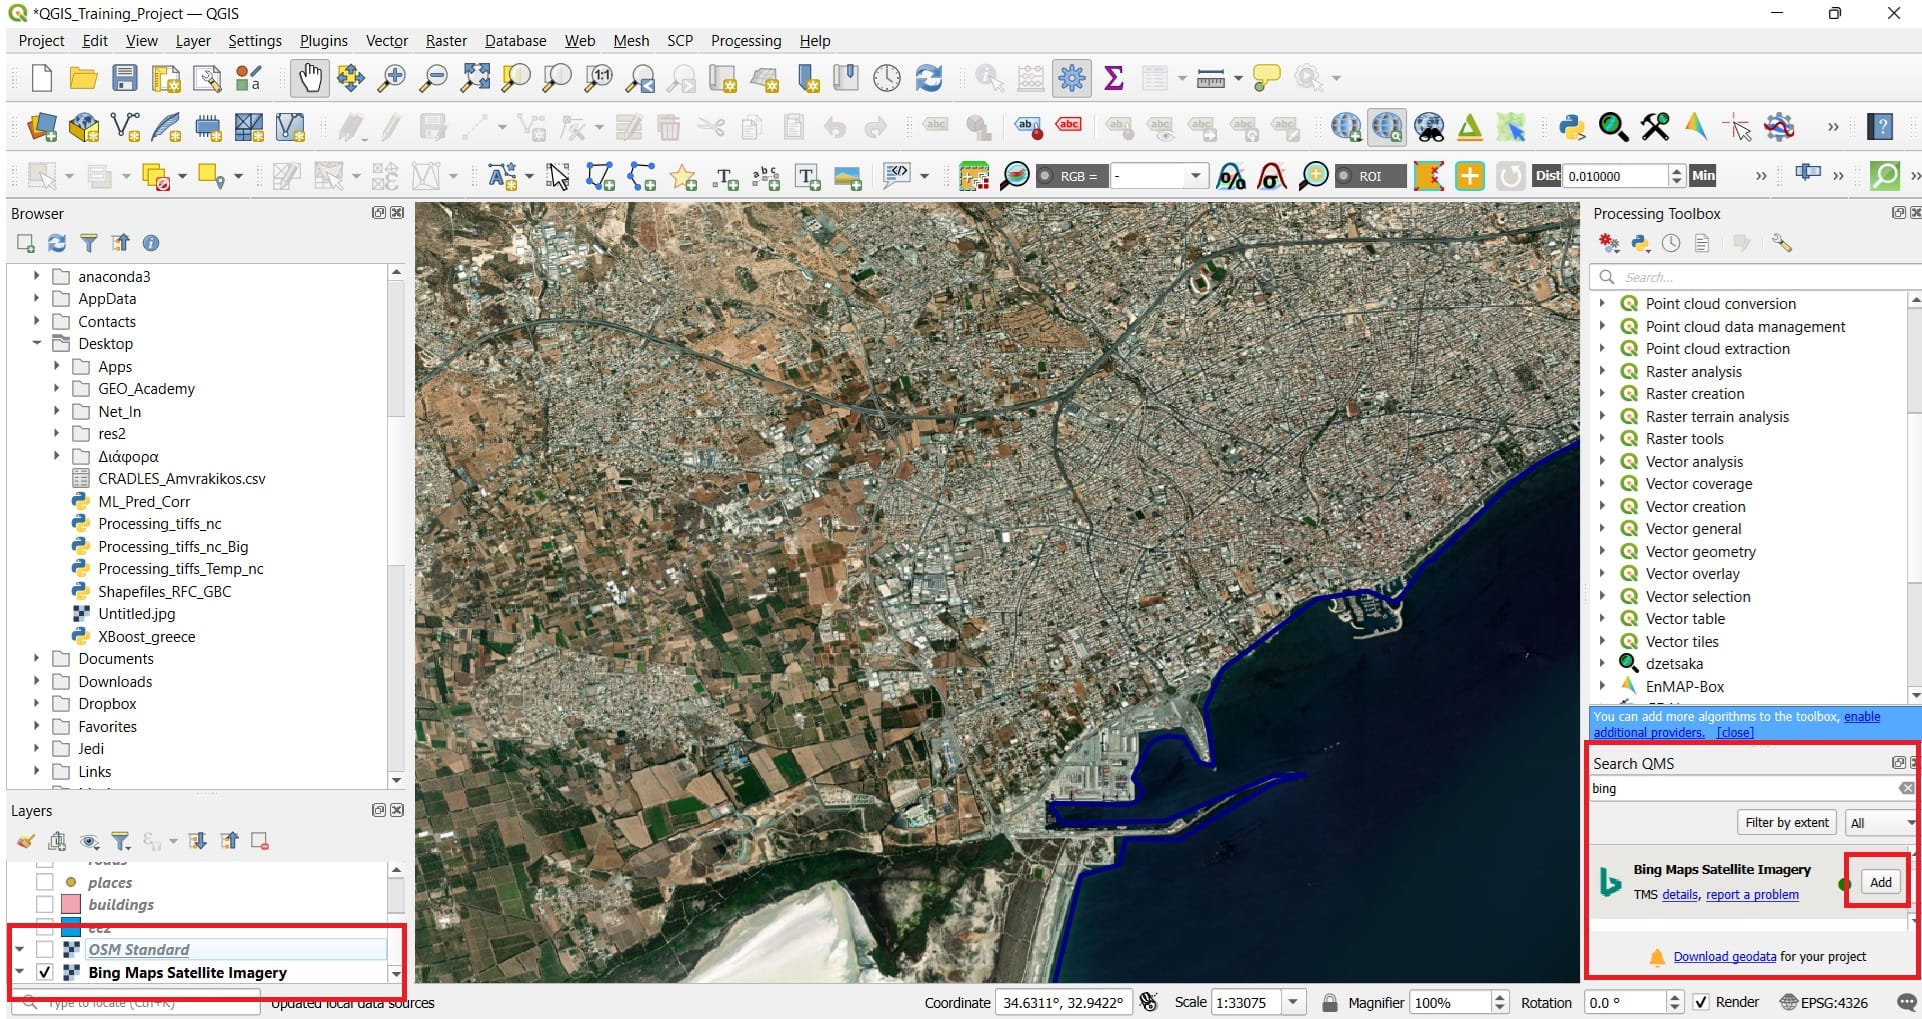
After you press ‘Add’, probably you will not see any changes but, that’s ok! ‘Bing Maps’ layer has been added but, it’s hidden below the first OSM Layer we have added! In the ‘Layers’ panel (see image below), just deselect (de-activate) the OSM Standard layer. Then, the ‘Bing Map’ layer will be shown!
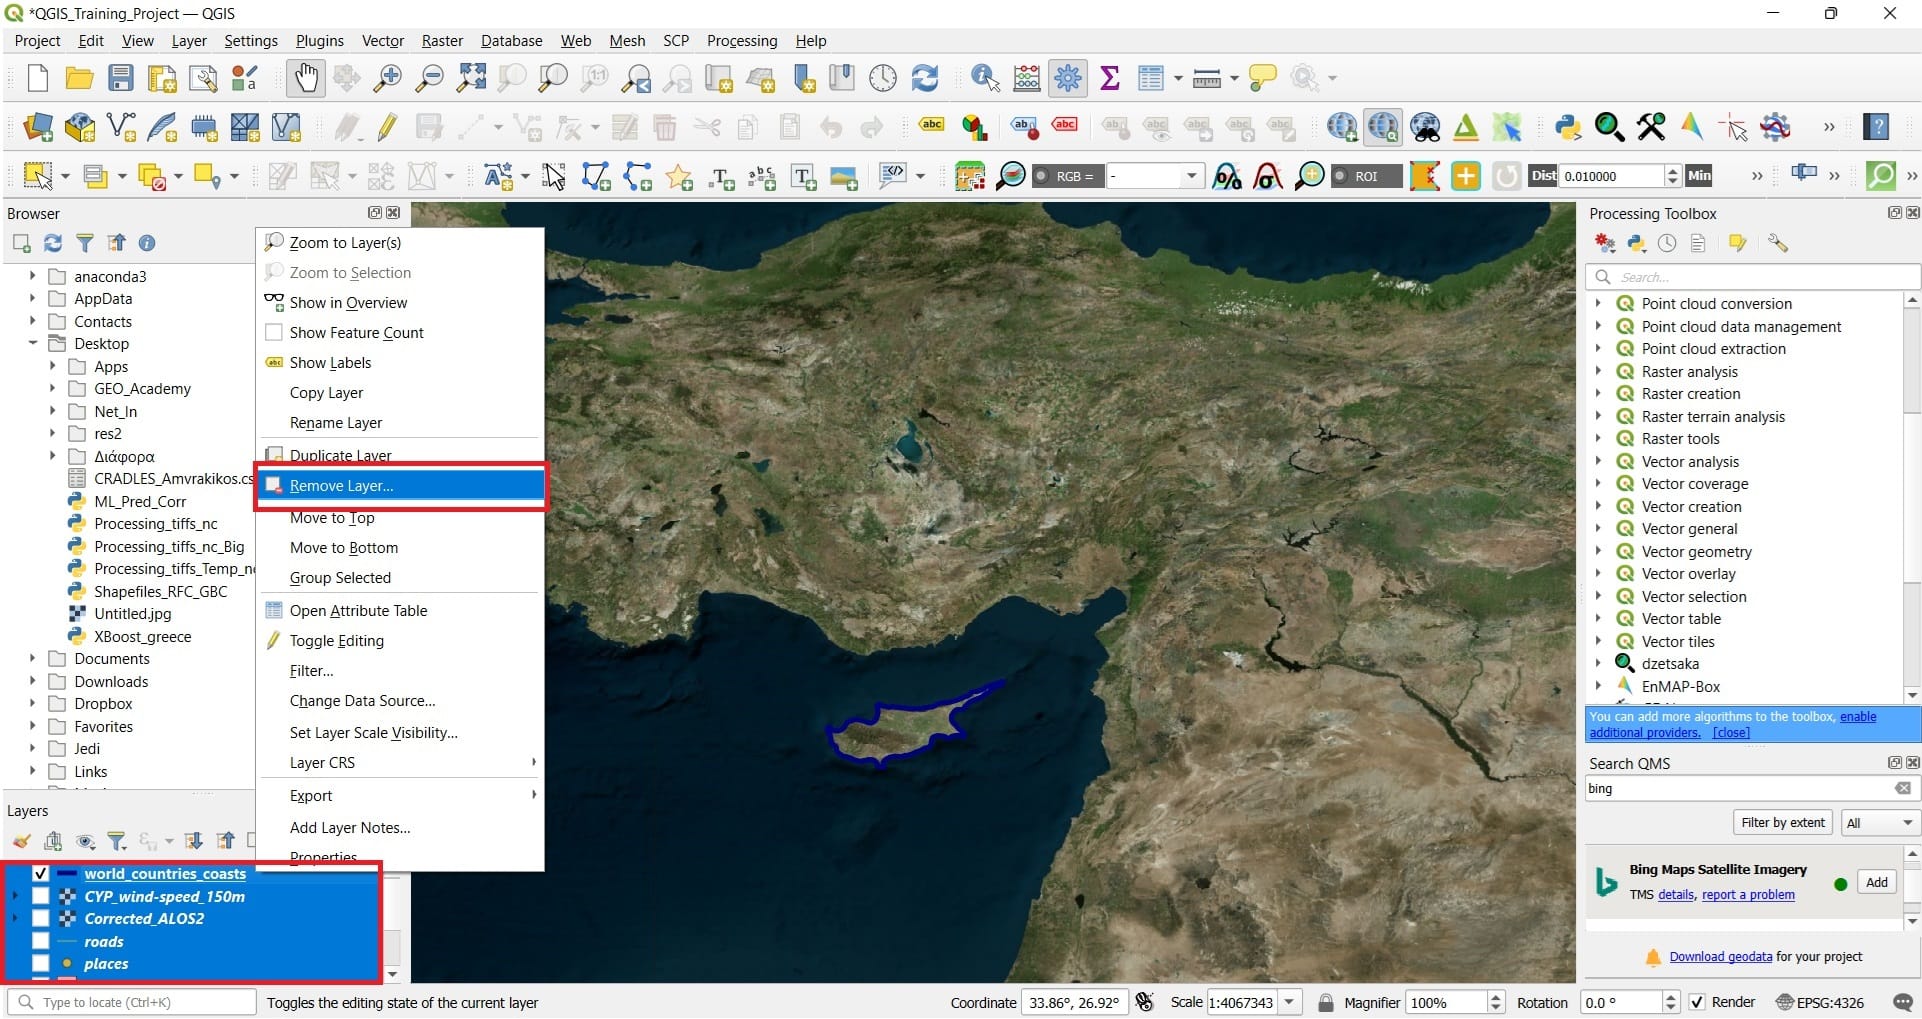
For our next exercise we will travel to Greece! To make our life easier, let’s remove all data related to Cyprus and just keep our ‘Bing Map’ basemap! To do that, we navigate to the ‘Layers’ window (bottom left corner in QGIS) and we select all layers (using Shift button) > Right click > ‘Remove layer’.
Let’s zoom out from Cyprus and zoom-in in Greece and in particular, in Athens!
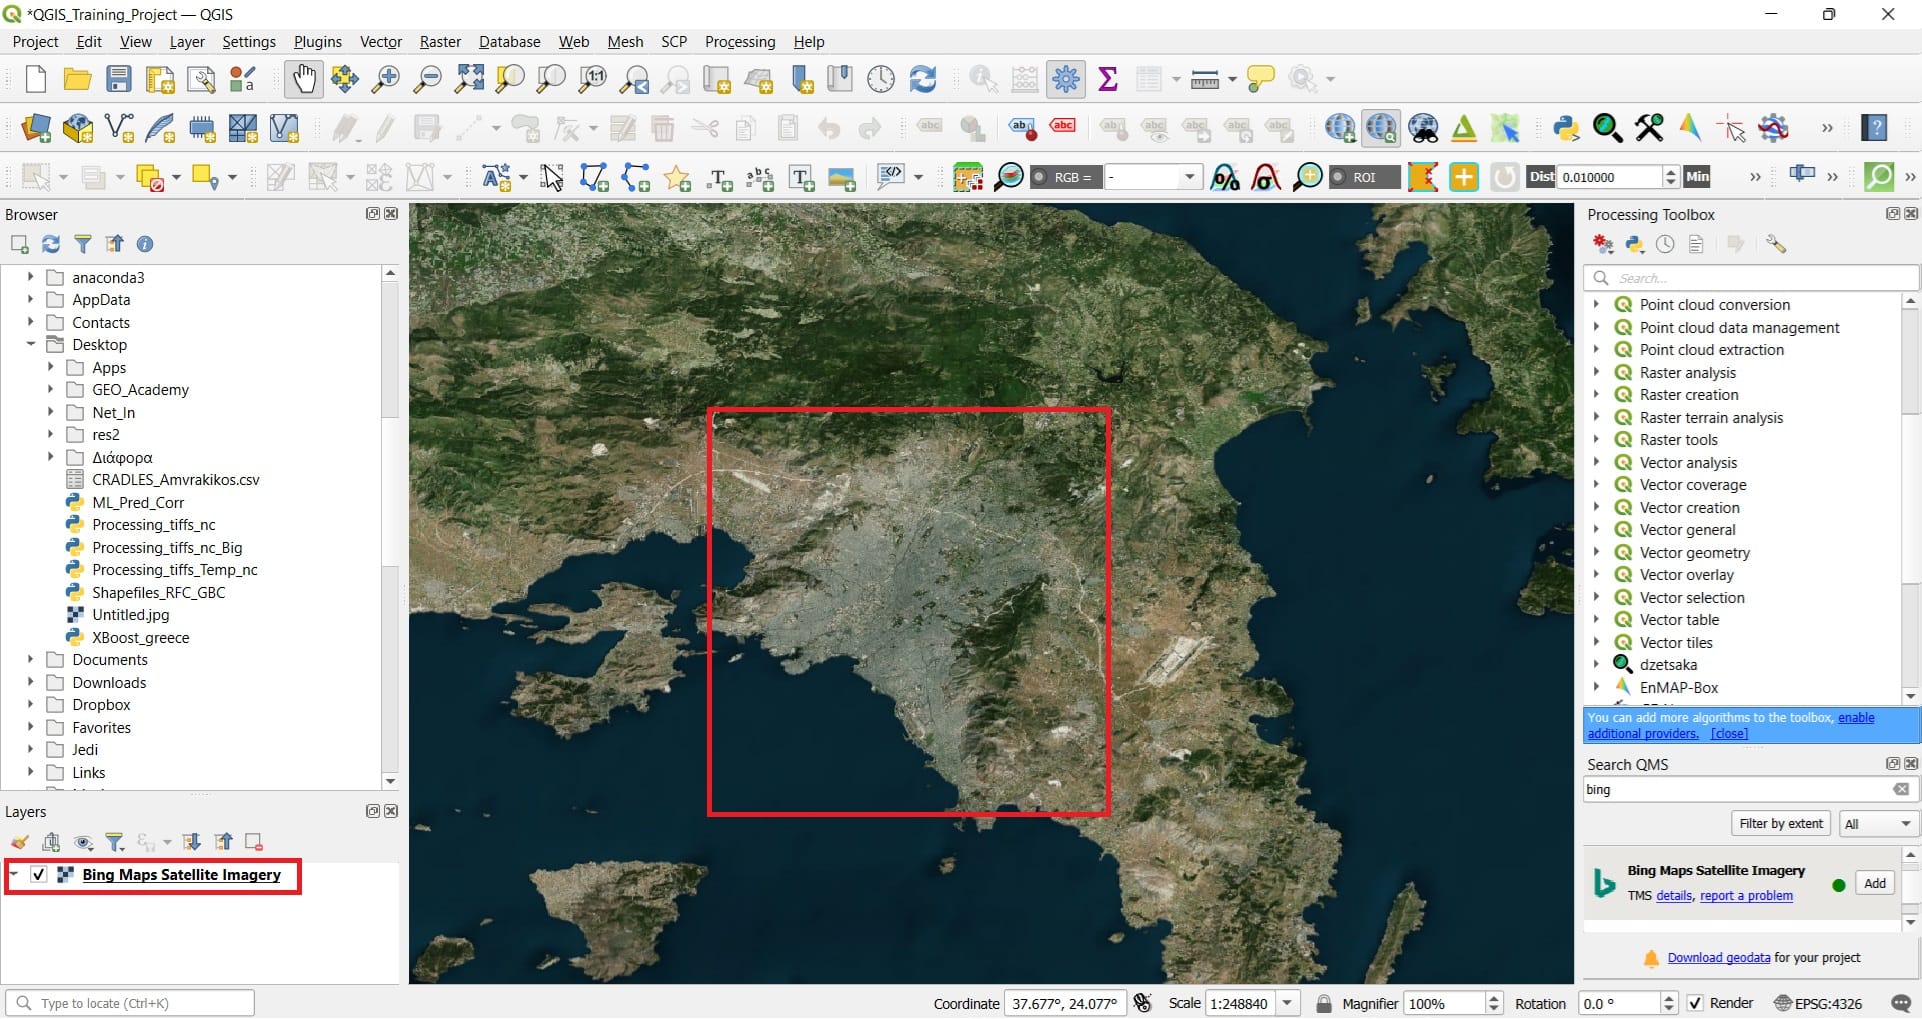
Let’s define our next task! Our main goal is to identify different green/park areas in Athens and digitize them. Digitize them? Yes, exactly, our goal is to create our own data in digitized form (i.e. a shapefile) which we can use in other exercises and projects! So far, we identified vector and raster data from different online repositories and services. This time, we will create our own dataset.
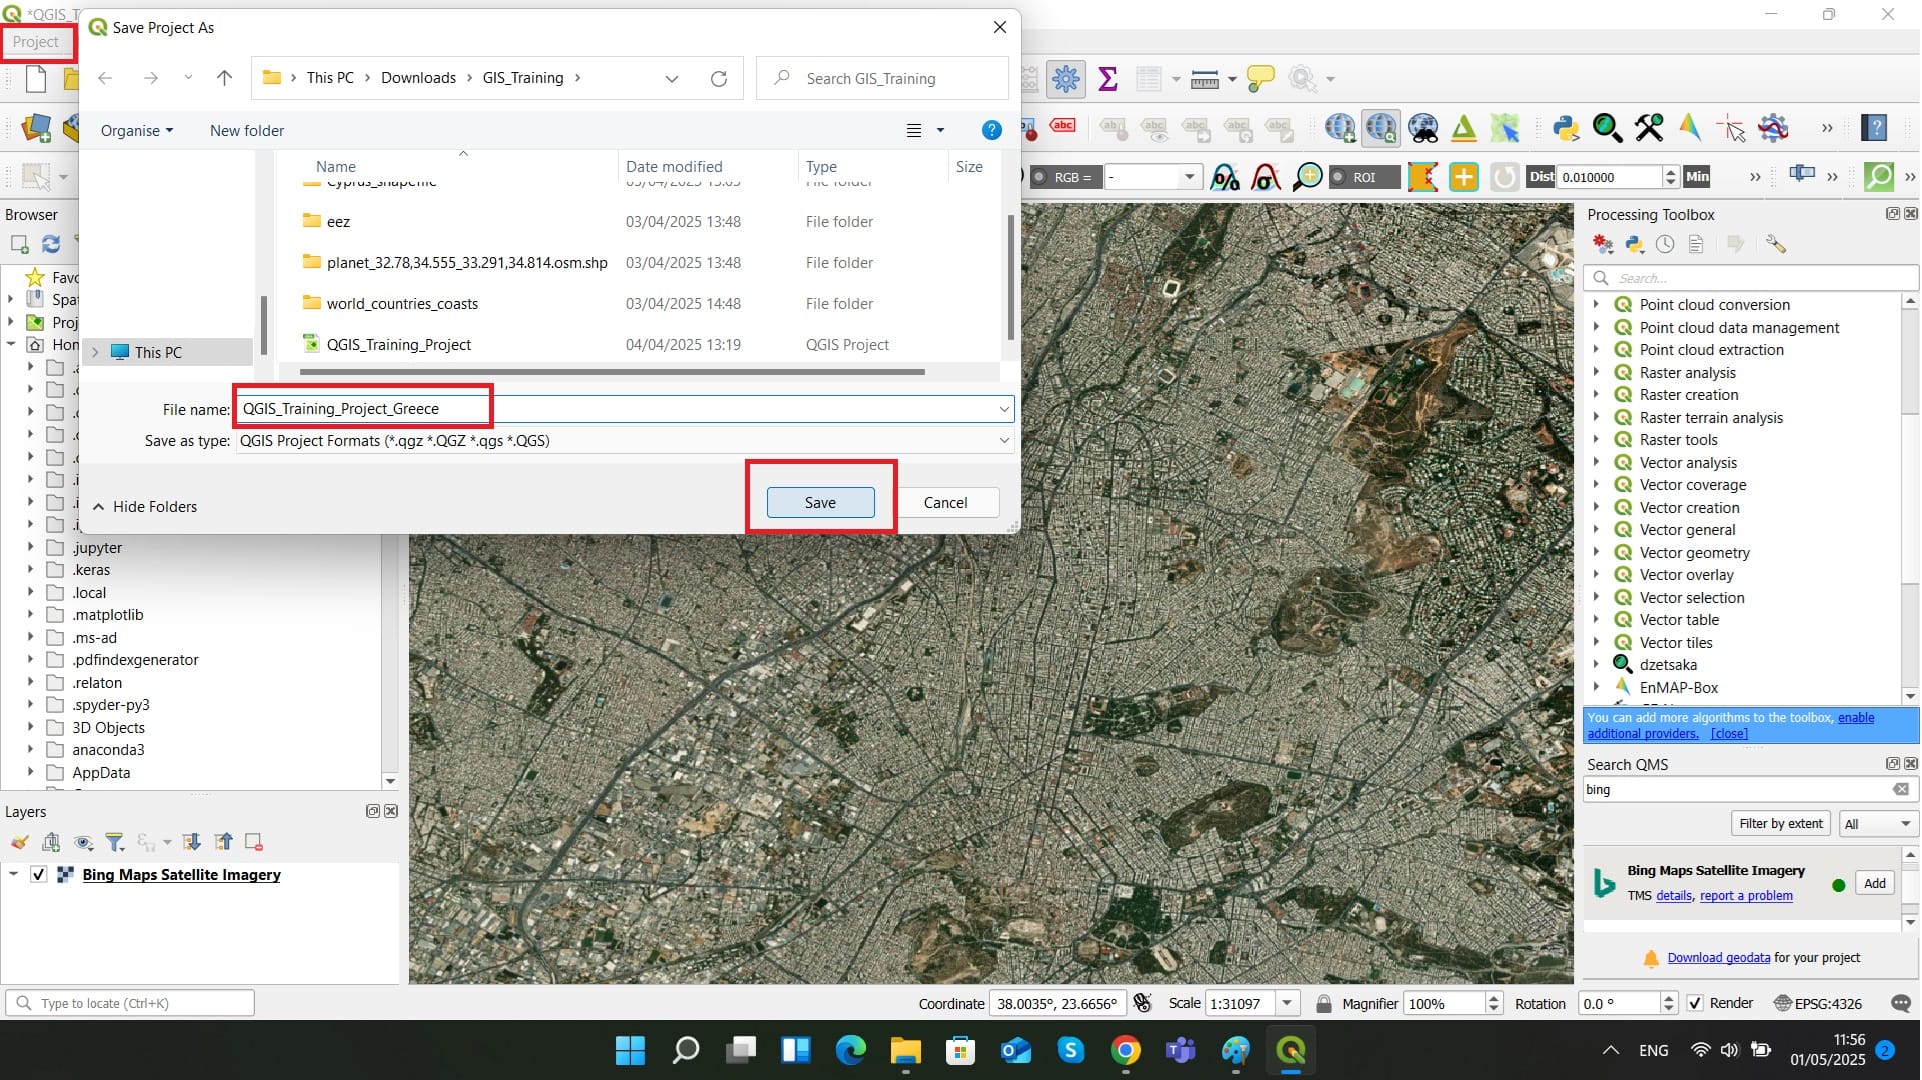
If we don’t want to lose all the work done so far for Cyprus, we can create a new project or save our current project with a different name. We simply select ‘Project’ on the main QGIS toolbar > ‘Save as’ > and we save our project with a different name, for example, ‘QGIS_Training_Project_Greece’.
Let’s explore our next task in the upcoming lesson!
✅ Wrapping Up: Processing Tools and Plugins in QGIS
You’ve just completed the course on Processing Tools and Plugins in QGIS—an essential step toward mastering spatial data analysis. In this lesson, you explored the core capabilities of the Processing Toolbox, learned how to perform key operations on vector and raster data in the upcoming lessons, and discovered how plugins can supercharge your QGIS experience.
✅ By now, you should be able to:
- Use the Processing Toolbox for spatial and attribute-based tasks
- Apply geoprocessing tools for clipping, converting, and analyzing vector and raster layers
- Install and manage plugins to extend QGIS with community-built tools
In the next course, we’ll shift our focus to a hands-on skill: Creating New Files and Digitizing Objects. You’ll learn how to build your own shapefiles, capture new features, and prepare datasets tailored to your project needs.
Great work—your GIS toolkit is getting stronger with every step! 🛠️🗺️📌