Platforms for data visualization
Introduction
Understanding and visualizing spatial data is essential for exploring geographic concepts in the classroom. Geographic Information Systems (GIS) provide powerful tools that combine maps, data analysis, and technology to help make sense of spatial information. By integrating cartography, statistical analysis, and database management, GIS allows us to analyze and present geographic data in meaningful ways.
As a primary or secondary school teacher, you don’t need to be a geospatial expert to bring GIS into your lessons. Whether you are new to spatial data or looking for practical tools to enhance your teaching, this course will guide you through finding, mapping, and using GIS applications to make geography, environmental studies, and other subjects more engaging for your students.
Best Tools for Spatial Data Visualization and Mapping in GIS
A variety of tools are available to help teachers and students explore and analyze spatial data. Whether you’re working on a desktop, online, or in the field, these GIS applications provide powerful ways to visualize geographic information, enhance lessons, and engage students in spatial thinking. Here are some key categories of GIS tools:
- Desktop GIS – Powerful software for creating, analyzing, and visualizing spatial data (e.g., QGIS, ArcGIS Pro).
- Web Mapping – Online platforms for interactive map creation and sharing (e.g., Google Earth, ArcGIS Online, OpenStreetMap).
- Mobile GIS Apps – Applications for collecting and analyzing spatial data on the go (e.g., Field Maps, SW Maps, Mappt).
- Spatial Analysis Software – Tools for processing and analyzing geospatial data (e.g., SAGA GIS, GeoDa).
- 3D Visualization Tools – Software for rendering and exploring 3D spatial data (e.g., Cesium, Google Earth, ArcGIS 3D Analyst).
Let’s dive into each of these categories!
1. Desktop GIS
Desktop GIS software provides powerful tools for visualizing, analyzing, and mapping spatial data. These platforms enable teachers and students to explore geographic information, create detailed maps, and conduct spatial analysis. With features such as layering, geoprocessing, and customizable map symbols, desktop GIS offers a dynamic environment for working with spatial data. Its ability to handle large datasets and perform advanced analysis makes it a valuable resource for integrating geography, environmental studies, and other subjects into the classroom.
Several leading tools for visualizing spatial data and creating maps within GIS encompass Esri’s ArcGIS suite, renowned for its extensive mapping functionalities and spatial analysis tools. QGIS, an open-source GIS software, is similarly esteemed for its strong features and the support of its community.
QGIS Platform (link)
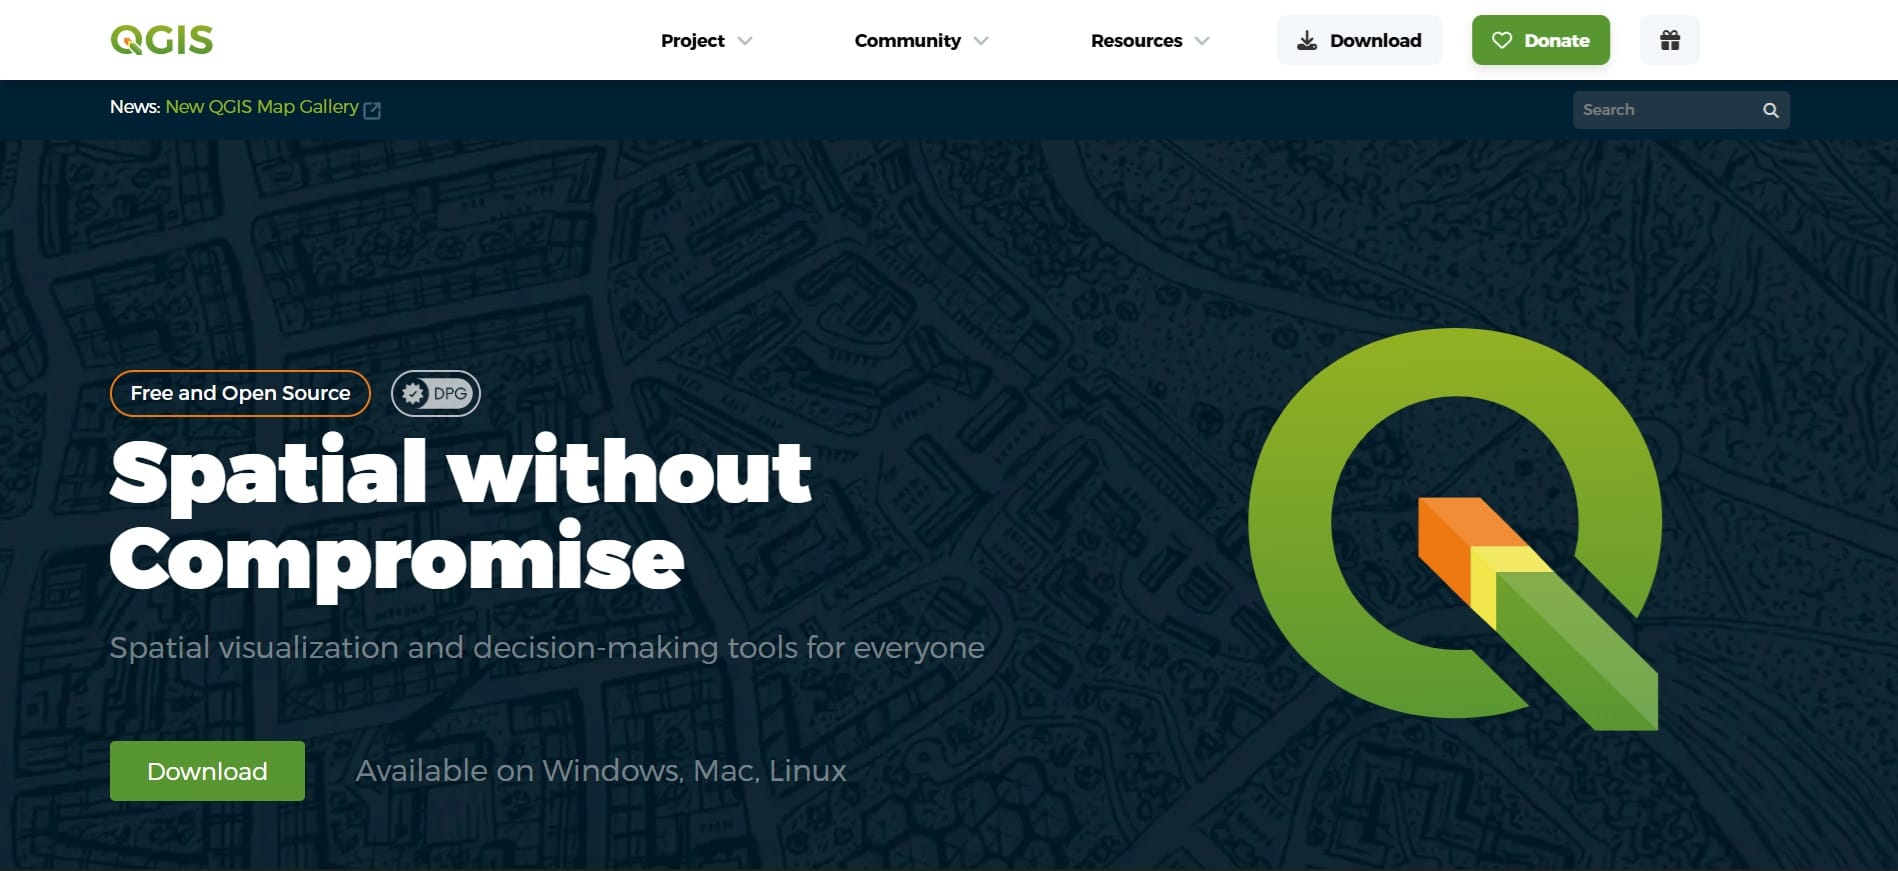
QGIS Tutorials for Beginners and Educators:
- QGIS Training Manual (link): This tutorial will be showing you how to use QGIS easily and efficiently. If you are new to GIS, we will tell you what you need to get started. If you are an experienced user, you will see how QGIS fulfills all the functions you expect from a GIS program, and more!
- QGIS Tutorials and Tips (link): This website contains a series of tutorials and tips that show you how to use it to tackle common GIS problems. You may use these tutorials as a self-paced course to learn the software thoroughly. However, each section is fairly independent, so those familiar with QGIS can jump into any section.
- QGIS Learning Resources (link): In addition to these tutorials, I also create and maintain hundreds of hours of free learning resources that includes free courses, videos and articles. Click on the link below to see my structured learning guide to access all the content.
Before we begin processing and analyzing data in QGIS within the next lessons, feel free to take a look at the following video—it offers a quick overview to help you get familiar with the tools and interface! 🎥🗺️✅
In the next sub-modules of this course, we will work with QGIS, guiding you step by step on how to download the software and start experimenting with basic geospatial data processing!
__________________________________________________________________________________________________________________________
ArcGIS Pro Suite (link)
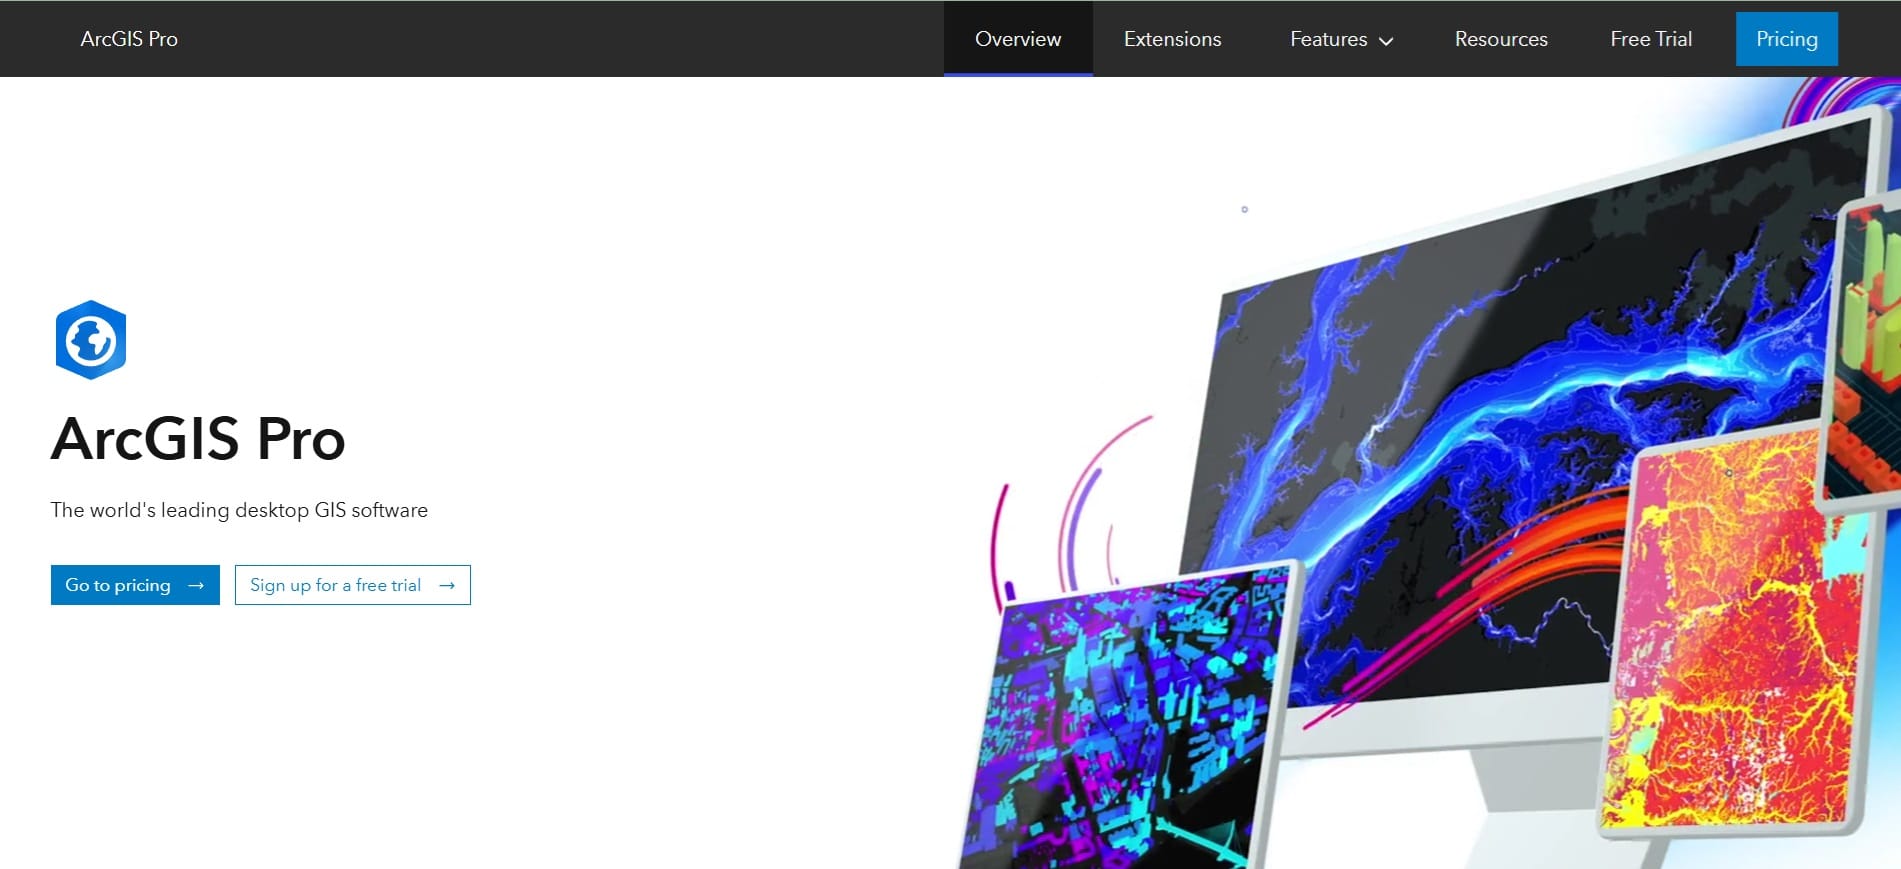
ArcGIS Pro Tutorials for Beginners and Educators:
- ArcGIS Pro quick-start tutorials (link): The ArcGIS Pro quick-start tutorials introduce you to many aspects of ArcGIS Pro. They cover basic operations, such as adding data and navigating in 3D, as well as complete workflows, such as authoring maps, sharing maps to ArcGIS Online, and building geoprocessing models. The tutorials range from 15 to 60 minutes and include a video that summarizes the workflow.
- Resources for teaching with ArcGIS Pro (link): Tutorial series for you and your students to become familiar with ArcGIS Pro.
- Teacher resources (link): A collection of on-boarding activities, tips and tricks, and educator activities.
Follow E-Module 4 about Map Storytelling in your Classroom if you need more learning experiences with ArcGIS Pro and ArcGIS Online! Also, in sub-module 4 of this course, we are exploring the GeoInquiries in your classroom, based on ArcGIS Online Teaching Resources!
2. Web Mapping
Web mapping tools have transformed the way spatial data is accessed, shared, and interacted with. These platforms allow users to create interactive maps that can be viewed and explored directly in a web browser, making geographic information widely accessible without the need for specialized software. Web mapping enhances engagement and facilitates communication of spatial concepts, particularly for non-technical audiences.
Popular web mapping tools include ArcGIS Online, Mapbox, MapMaker, Google Maps and Copernicus Browser, among others, which offer user-friendly interfaces, interactive features, and APIs for integrating maps into websites and applications. These tools are commonly used for real-time mapping, public data sharing, and interactive geographic storytelling. Let’s explore some of them!
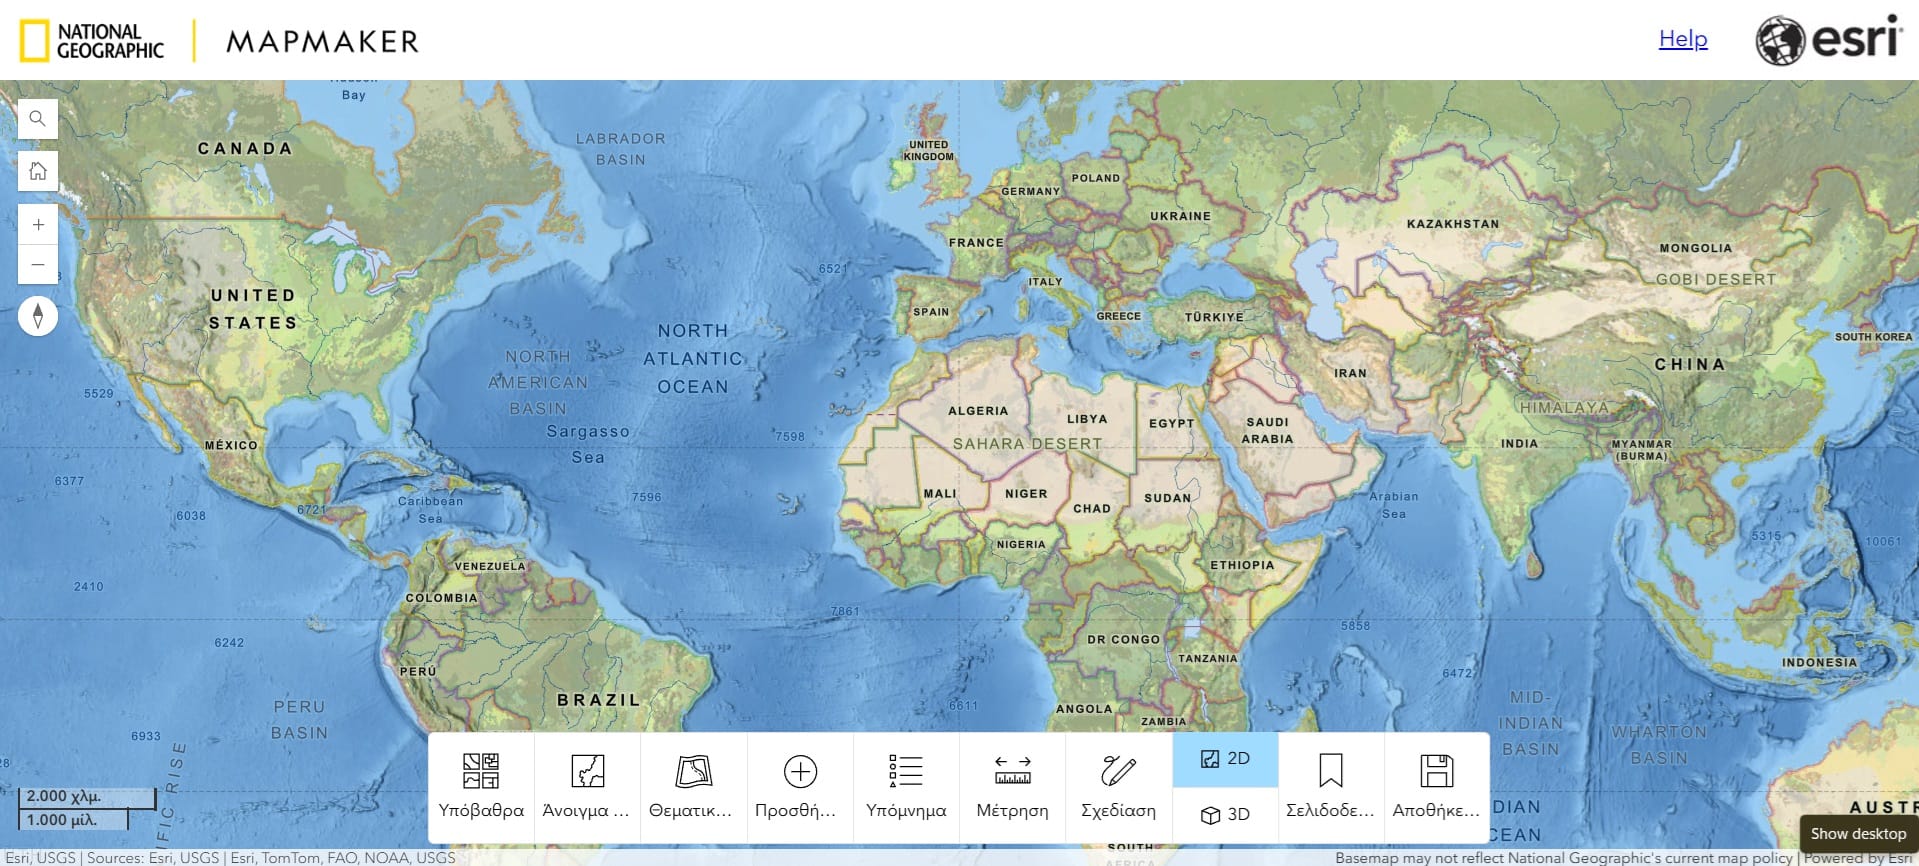
MapMaker (link)
A new way to teach and learn with maps. MapMaker supports student learning with high-quality, curated map content, powerful mapping tools, and teacher support. Today’s students will solve the world’s problems. As an educator, you can use maps to give them the knowledge and tools they need to find solutions. Use MapMaker in your lessons to help students build spatial thinking skills and develop knowledge about the world by exploring interactive maps.
Useful educational resources on how to use MapMaker:
- MapMaker Collection (link): This collection contains educational resources specifically designed to accompany National Geographic MapMaker, a Geographic Information System (GIS) tool for the classroom, developed by National Geographic and Esri. Maps allow us to find our way, analyze and visualize complex datasets, solve problems, and tell stories. They also facilitate learning.
- MapMaker GeoInquiries (link): GeoInquiries™ are short, standards-based inquiry activities for teaching map-based content found in commonly used textbooks. Each activity is designed using a common inquiry model and can be presented quickly from a single computer and projector or modified for students’ hands-on engagement. Collections of 15–20 activities per topic enhance your curriculum throughout the year. Also, follow sub-module 4 of this course and check our step-by-step guide on how to use MapMaker and GeoInquiries!
You may also check the following videos to get an idea of how MapMaker works!
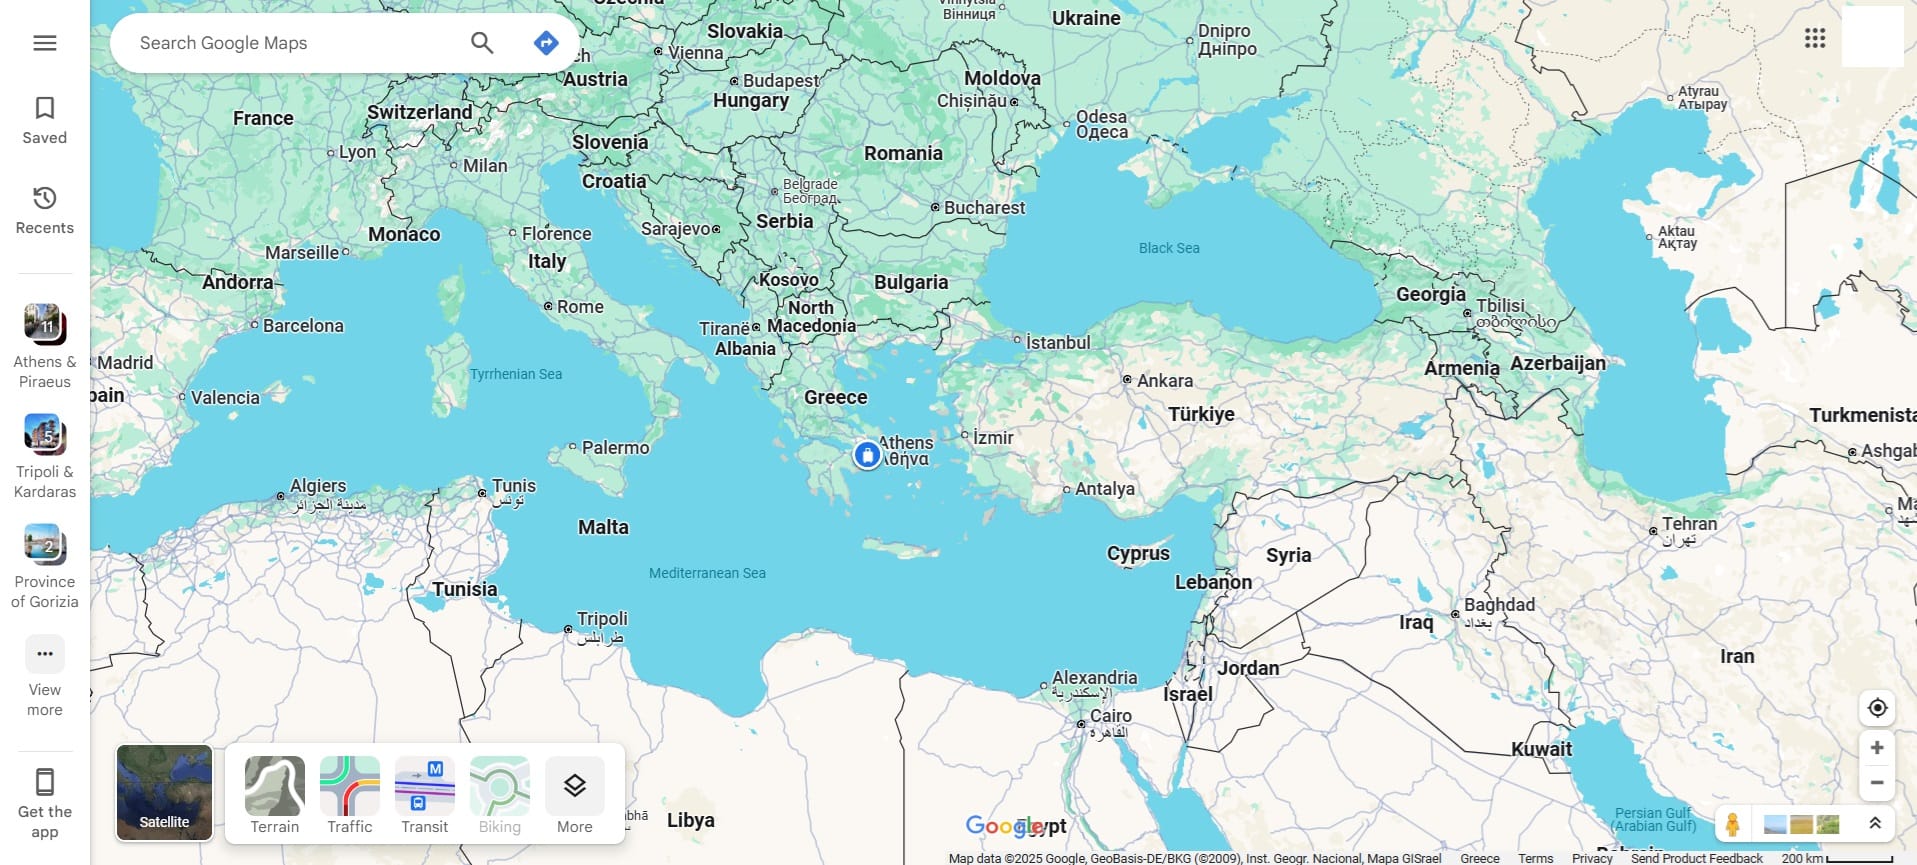
Google Maps (link)
Ok, we all know and use Google Maps in our daily lives. Google Maps is a web service that provides detailed information about geographical regions and sites worldwide. In addition to conventional road maps, Google Maps offers aerial and satellite views of many locations. However, are there any special capabilities of Google Maps?
Google Maps Capabilities:
- Google Maps Help (link): Google Maps offers several useful features to enhance navigation and exploration. You can contribute by sharing reviews, photos, and knowledge, earning points and recognition. Organizing your favorite locations is easy by creating lists of saved places for quick access. Real-time location sharing helps others find you when meeting up. If you’re traveling to areas with limited internet, downloading maps in advance allows for offline navigation. Route customization lets you avoid tolls, ferries, or highways based on your preferences. With Street View, you can explore places up close through immersive images. Additionally, Google Maps allows you to measure distances between multiple points and find exact latitude and longitude coordinates for any location.
- Google Maps features that help me navigate more confidently (link): Get from A to B a bit more easily (and on time)!
For more activities and ideas, check the following videos!
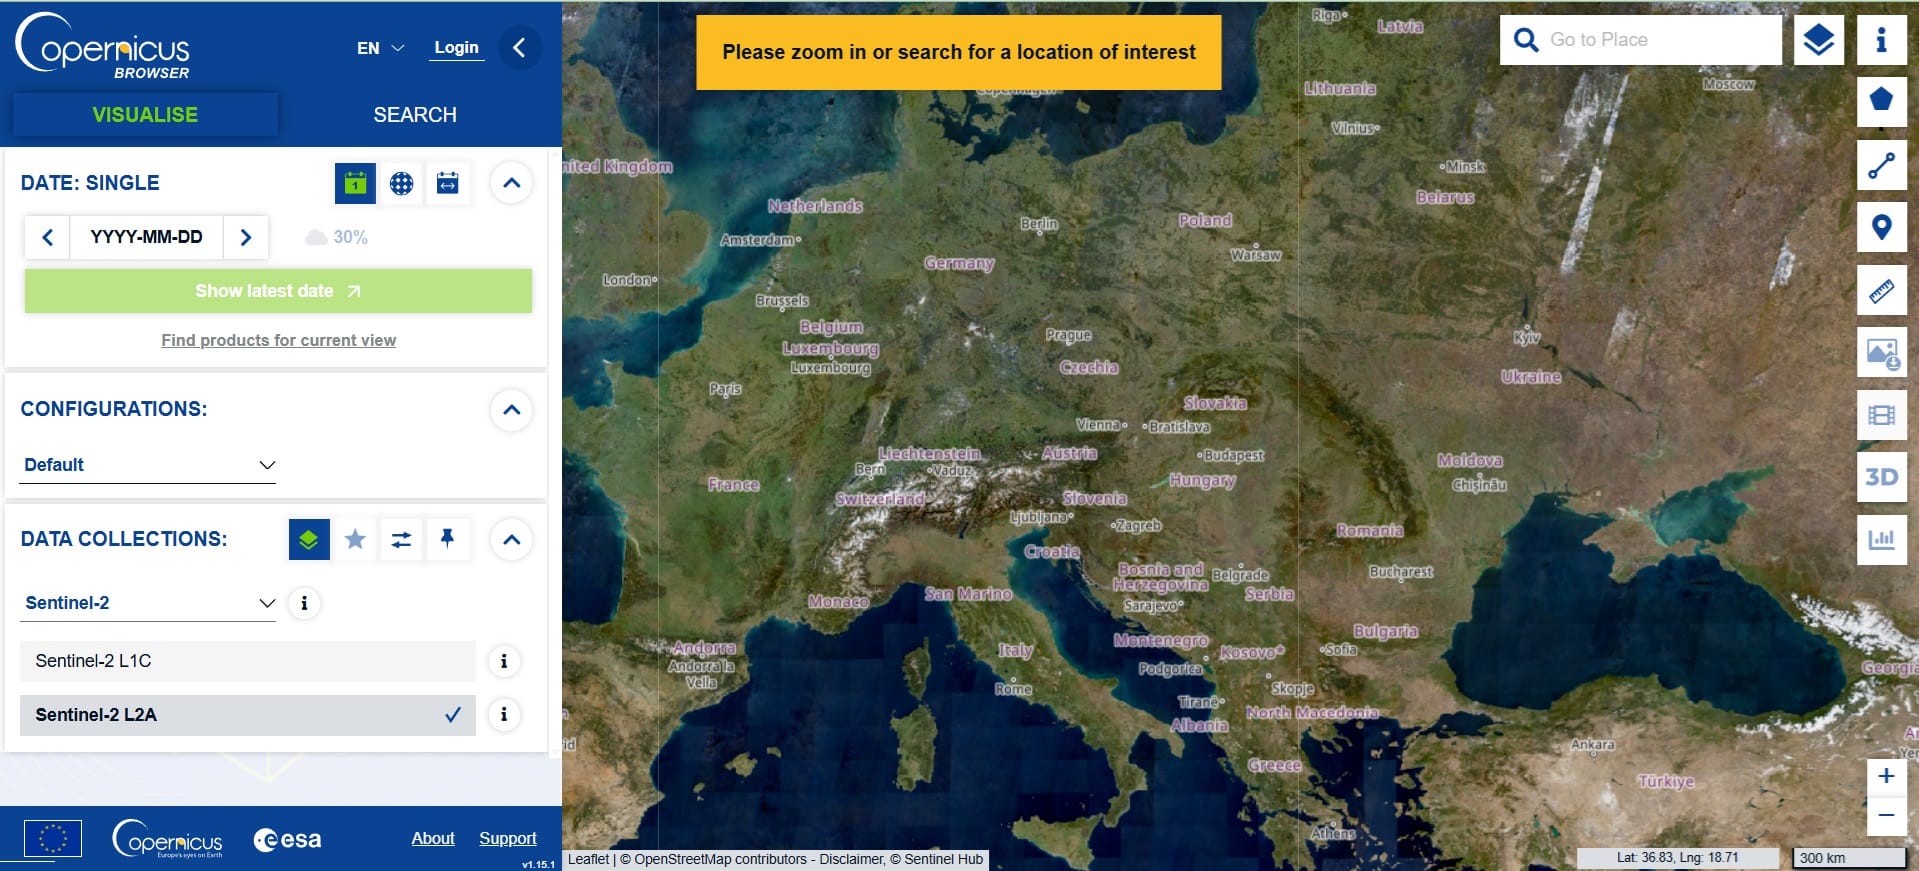
Copernicus Browser (link)
School is boring, students just want to play around on their phones all day? School is exciting, you get to meet your friends and learn new things?Whichever your attitude, whether you are a teacher or a student, Copernicus Browser can make your day. Satellite images break the boundaries of human perception: we see things of sizes or time scales that we would never encounter in real life. But satellite images are also complex to access and view, right? In a way, this is – at least connected to – rocket science, after all…
Useful Resources on how to use Copernicus Browser:
- About the Platform – Tutorial (link): The Copernicus Data Space Ecosystem Browser serves as a central hub for accessing, exploring and utilizing the wealth of Earth observation and environmental data provided by the Copernicus Sentinel constellations, contributing missions, Auxiliary engineering data, on-demand data and more…
- Back to School with Copernicus Browser (link): Copernicus Browser can be an exciting and insightful school experience. Whether for verification of daily news, visualization of processes as they happen or taking a look at broad-scale patterns of the earth, satellite imagery can provide an unmatched view, speaking not only to our minds but also our hearts.
- Teaching Geography with Satellite Imagery (link): Learn how to search, explore and navigate satellite imagery to explain geographic patterns and processes.
If you want test Copernicus Browser features, check the following video:
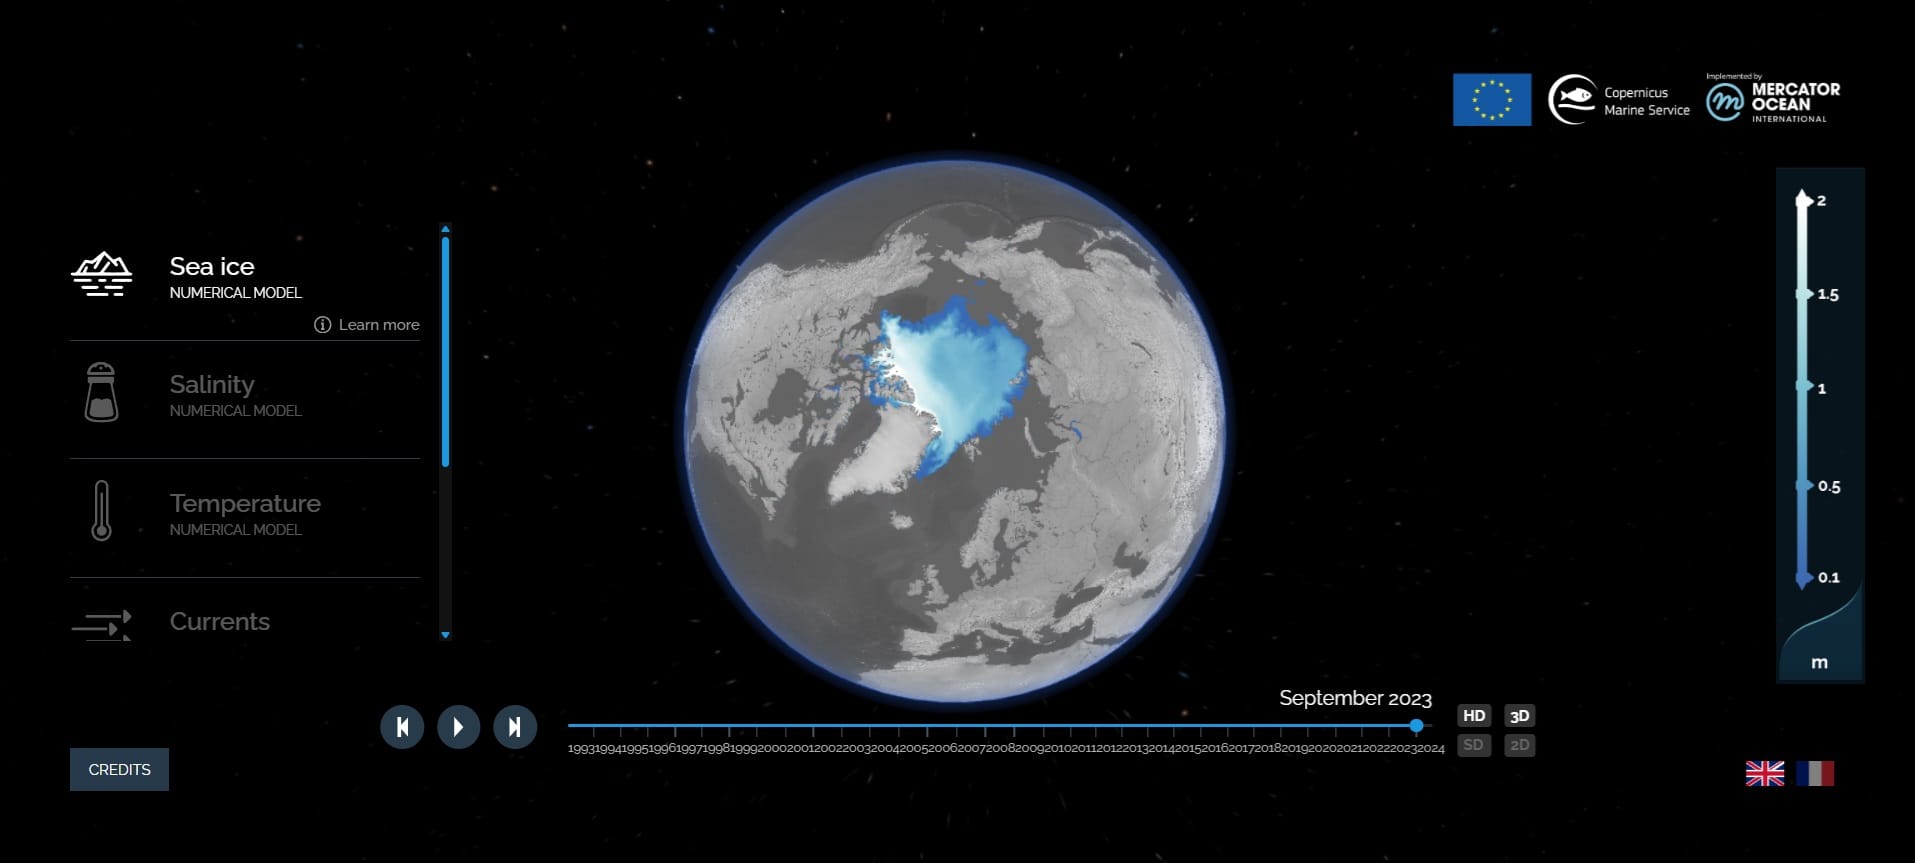
Copernicus Browser – MyOcean (link)
Explore ocean variables across the Blue, White, Green Ocean with ocean literacy materials. Data updated twice a year. MyOceanLearn Platform also includes educational materials and videos to explain how the ocean machine functions.
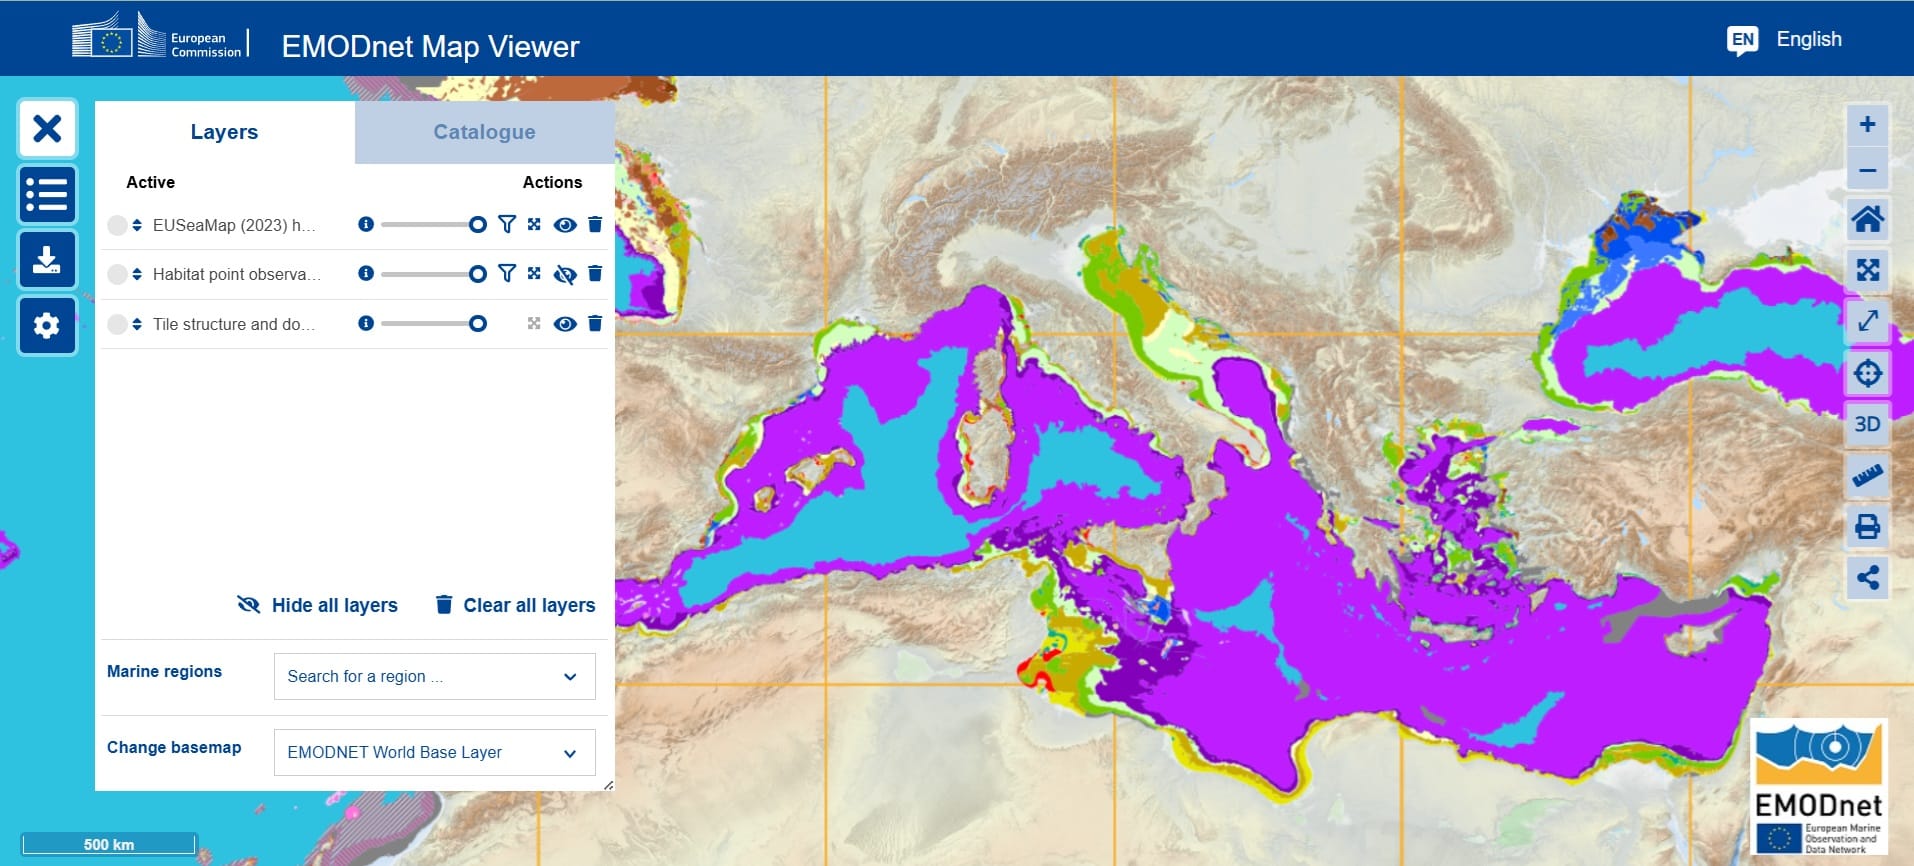
EMODnet Map Viewer (link)
Are you interested in Marine Sciences? EMODnet is the creation and publication of integrated European-scale marine data layers and data products spanning the marine environment and human activities. The EMODnet MapViewer provides some of the visualization controls of a traditional GIS but, it does not provide any geospatial processing services, such as geostatistical processing. This is intentional! The primary role of the MapViewer is to aid the discovery, visualization and download of EMODnet products.
Useful resources on how to use the EMODnet Map Viewer:
- The EMODnet Map Viewer, your tool to data discovery (link): Check how you can visualize different types of marine data like bathymetry, seabed substrate and habitats as well as different biological, chemical and geophysical parameters across Europe (check the Catalogue options in the Image below)
Or you can quickly check the following video on how to use the EMODnet Portal:
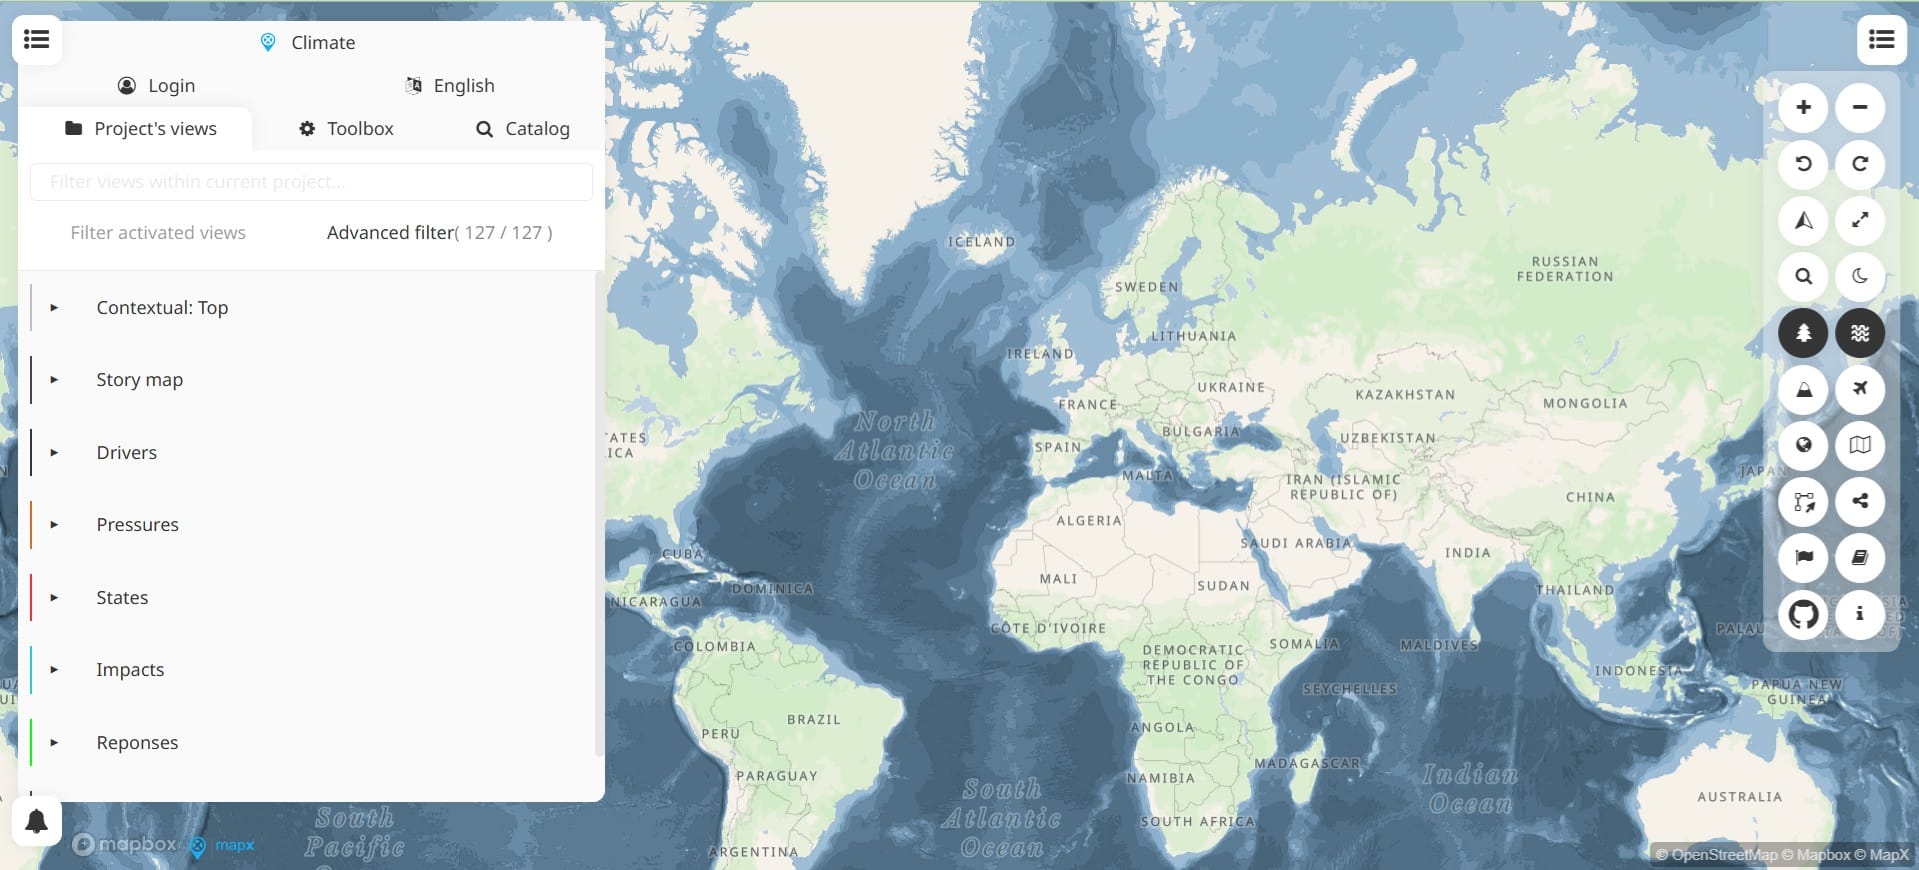
United Nations Environment Program (UNEP) – Essential Sustainable Development Variables (link)
The MapX platform, developed by the United Nations Environment Programme (UNEP), is a cloud-based geospatial tool designed for environmental data visualization, analysis, and decision-making. It integrates spatial data from various sources, enabling users to explore environmental datasets interactively.
The platform specializes in environmental data, offering high-resolution global and regional datasets related to biodiversity, pollution, climate change, land use, and marine ecosystems. These datasets are curated by UNEP and its partners, ensuring reliable and up-to-date information. Users can view and analyze spatial datasets in various formats, including vector-based files like shapefiles and GeoJSON, as well as raster data such as GeoTIFFs. Some layers are available for download, allowing further analysis in GIS software like QGIS. MapX also includes advanced data exploration and analysis tools. Users can perform spatial queries, extract information from specific locations, and use time-series visualizations to track environmental changes over time. Additionally, basic statistical and analytical tools are available to support geospatial assessments. As a cloud-based platform, MapX requires no installation, making it accessible from any device with a web browser. It also supports multiple languages, ensuring accessibility for a diverse range of users worldwide.
Potential Uses for Educators:
- Teaching students how to navigate GIS interfaces and explore real-world environmental data.
Using datasets for climate change and sustainability lessons in geography, science, and environmental studies.
3. Mobile GIS Apps
Mobile GIS applications bring the power of spatial data visualization, collection, and analysis to smartphones and tablets. These apps enable users to gather and map geographic information in real time, making them particularly useful for fieldwork, environmental monitoring, and community-based mapping projects. With GPS integration and offline functionality, mobile GIS enhances the efficiency of data collection and spatial decision-making.
Notable mobile GIS apps include:
- Windy – Weather radar, wind and waves forecast for kiters, surfers, paragliders, pilots, sailors and anyone else.
- ArcGIS Field Maps – A comprehensive app for collecting, visualizing, and analyzing geospatial data in the field.
- Global Solar Atlas – The Global Solar Atlas (GSA) is a free, online, map-based application that provides information on solar resource and photovoltaic power potential globally.
- Global Wind Atlas – This interface provides access to a broad selection of wind atlas datasets from the New European Wind Atlas project.
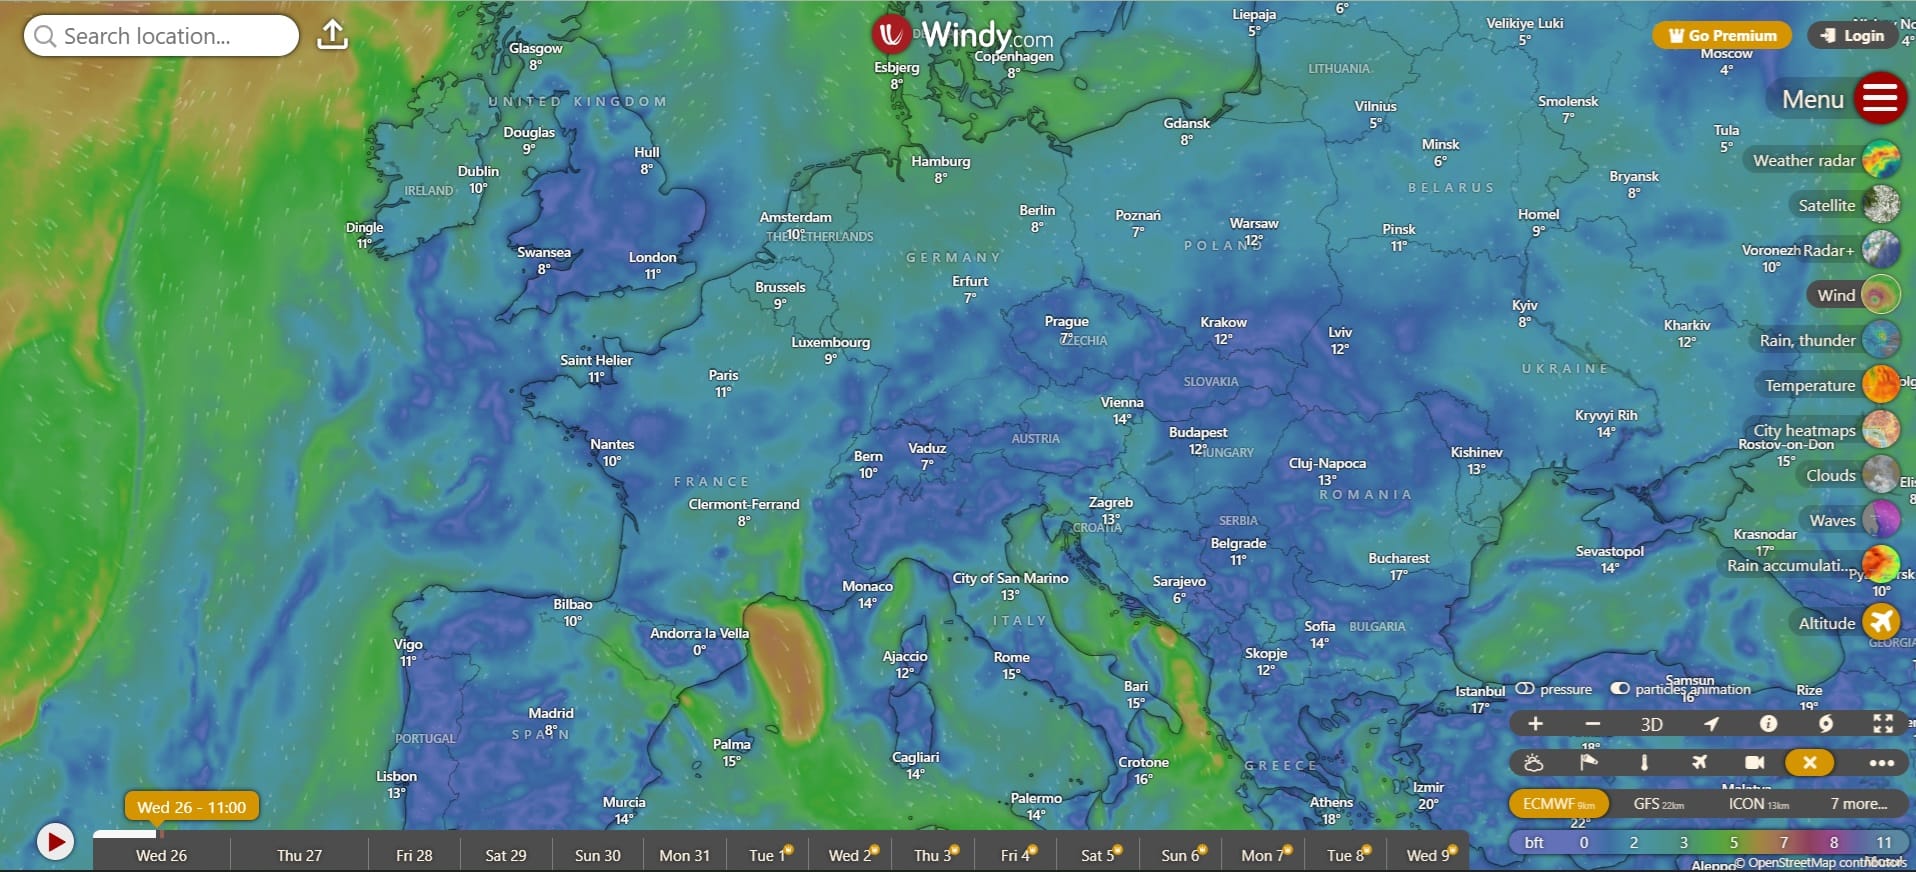
Windy (link)
Windy.com (and the Windy app) is an exceptional tool for visualizing weather forecasts. It’s fast, intuitive, detailed, and one of the most accurate weather apps available. Trusted by professionals in fields such as aviation, sports, and environmental monitoring, Windy can also be a valuable resource for educators. Teachers can use it to enhance lessons on weather patterns, geography, and environmental science, helping students engage with real-time data and gain a deeper understanding of the natural world.
Useful information for the App and how-to answers:
Or the following video explainingin 2 minutes how to use the Windy app!
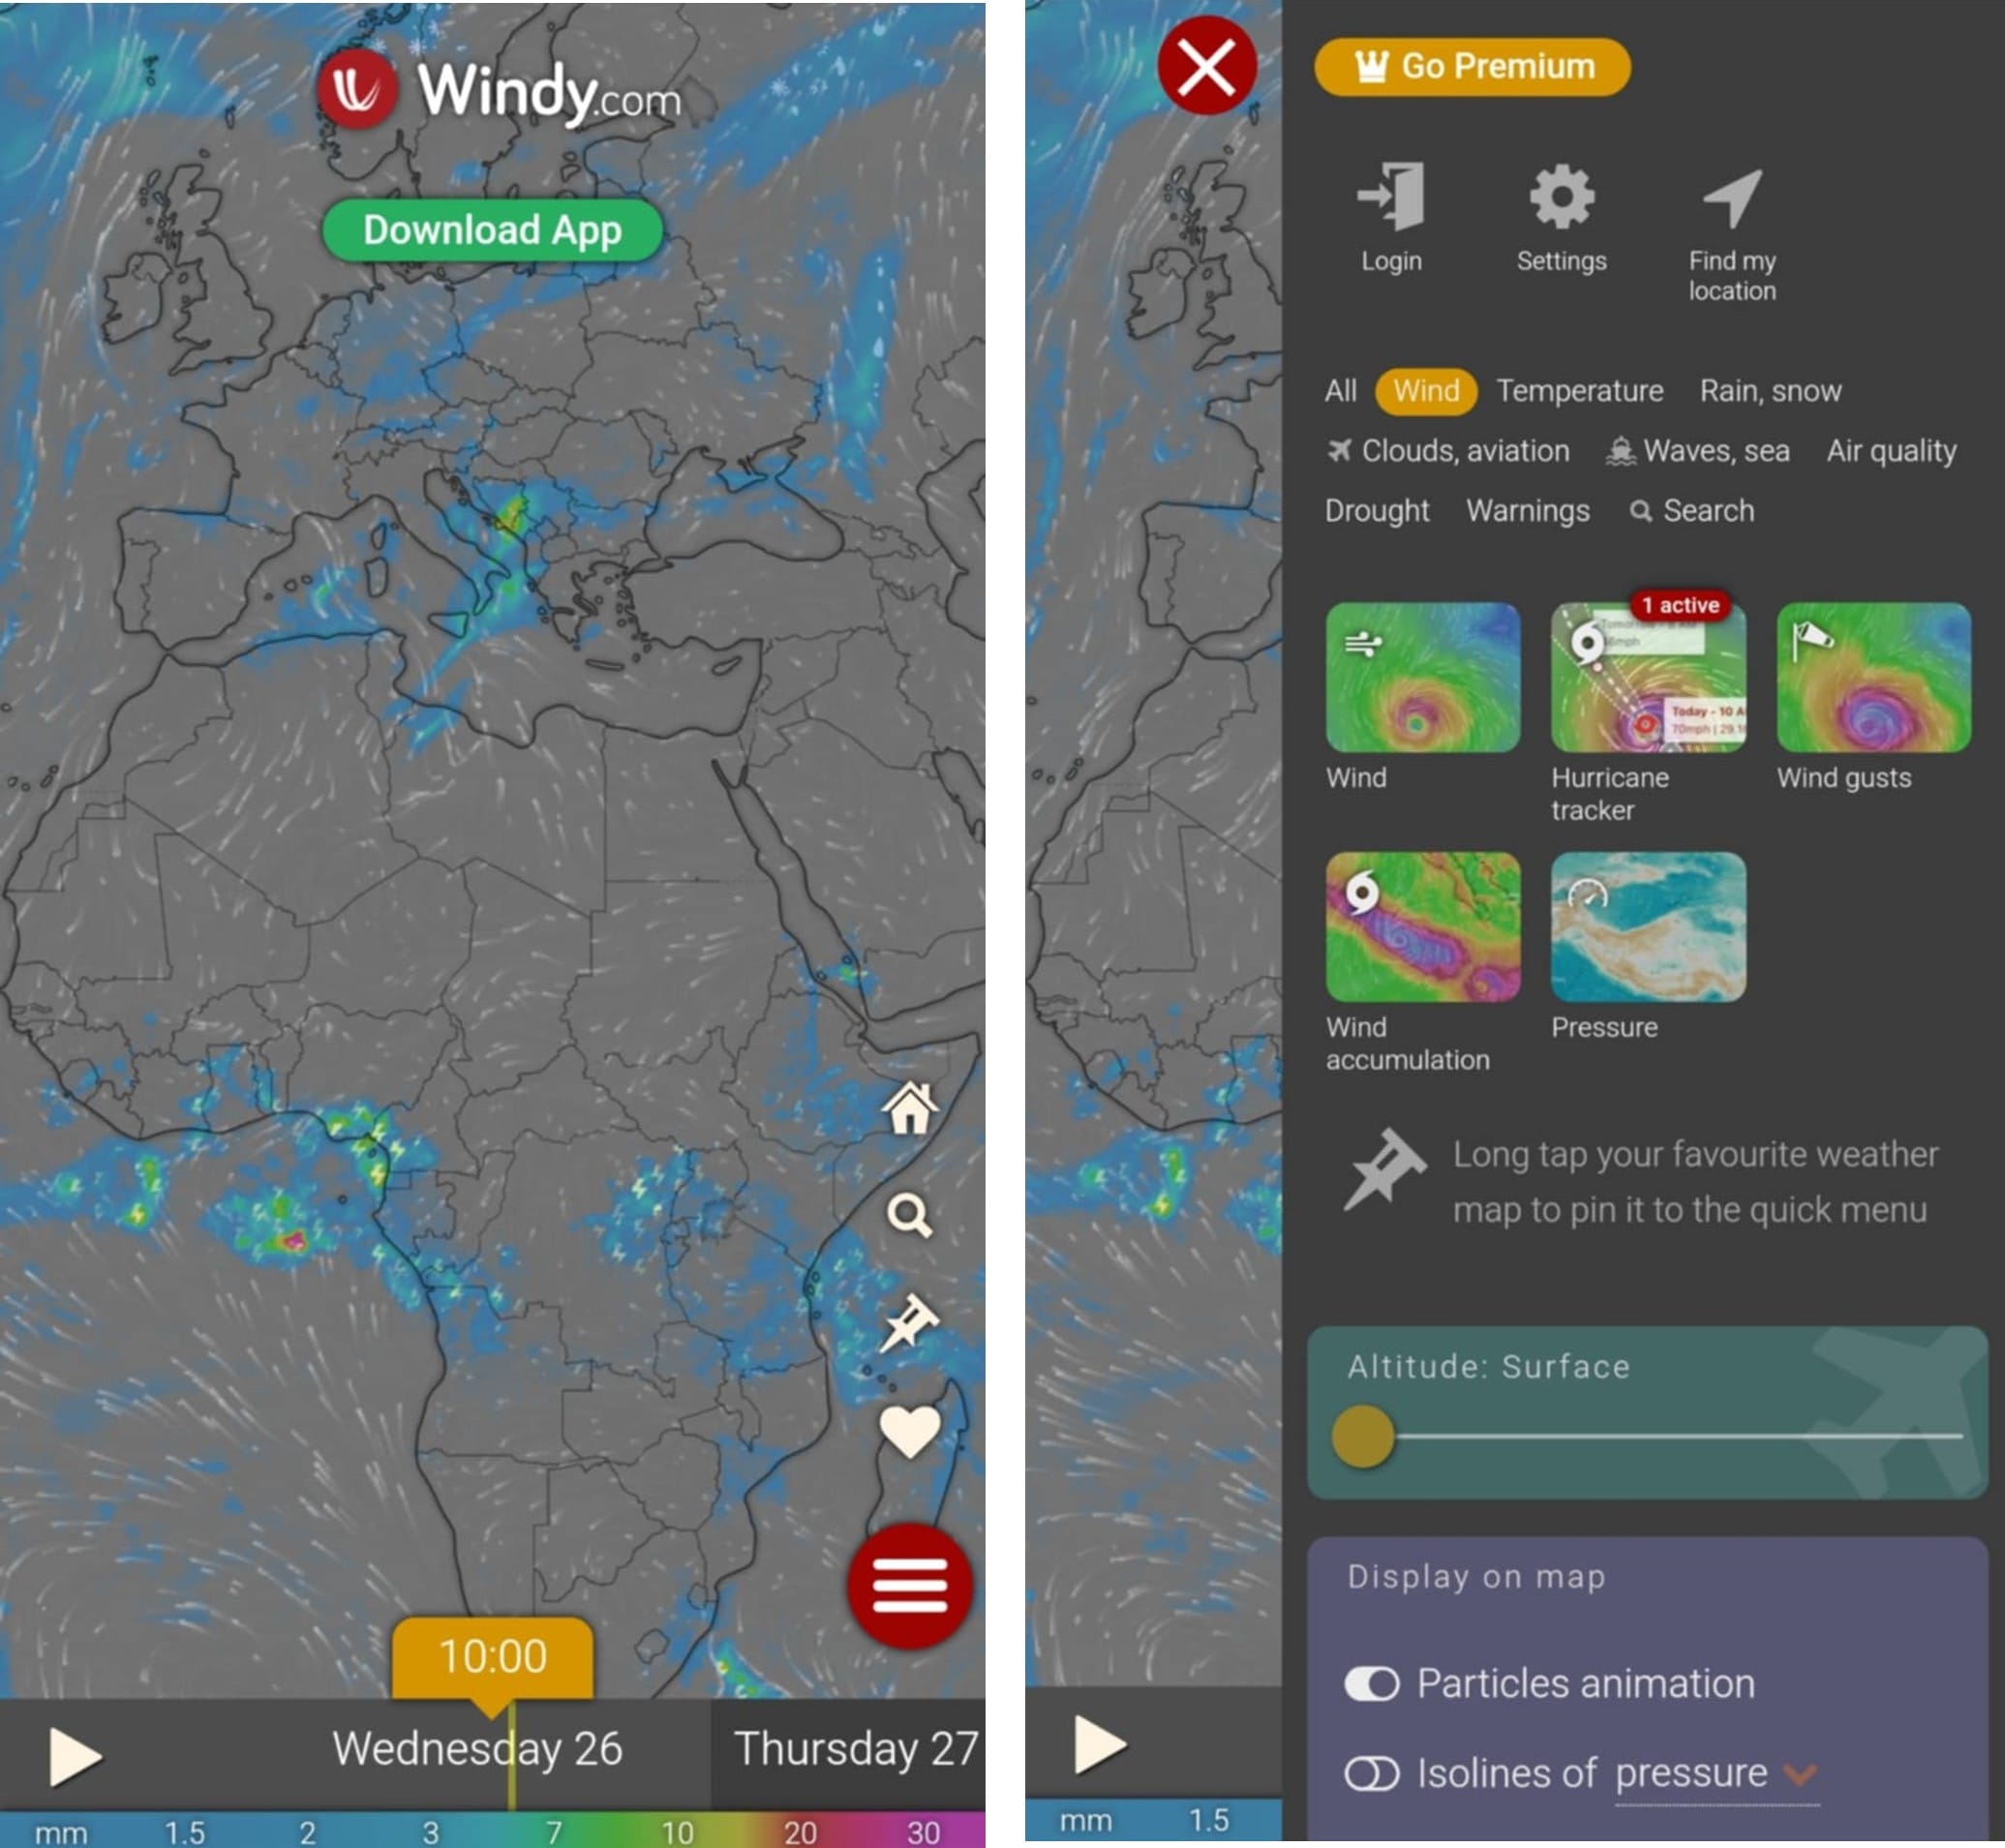
BONUS: Hurricanes Tracking: You may download the App or use your browser from your phone/tablet. You can track typhoons by only pressing 2 buttons. First the Menu icon (top right corner) > Wind > Hurricane Tracker!
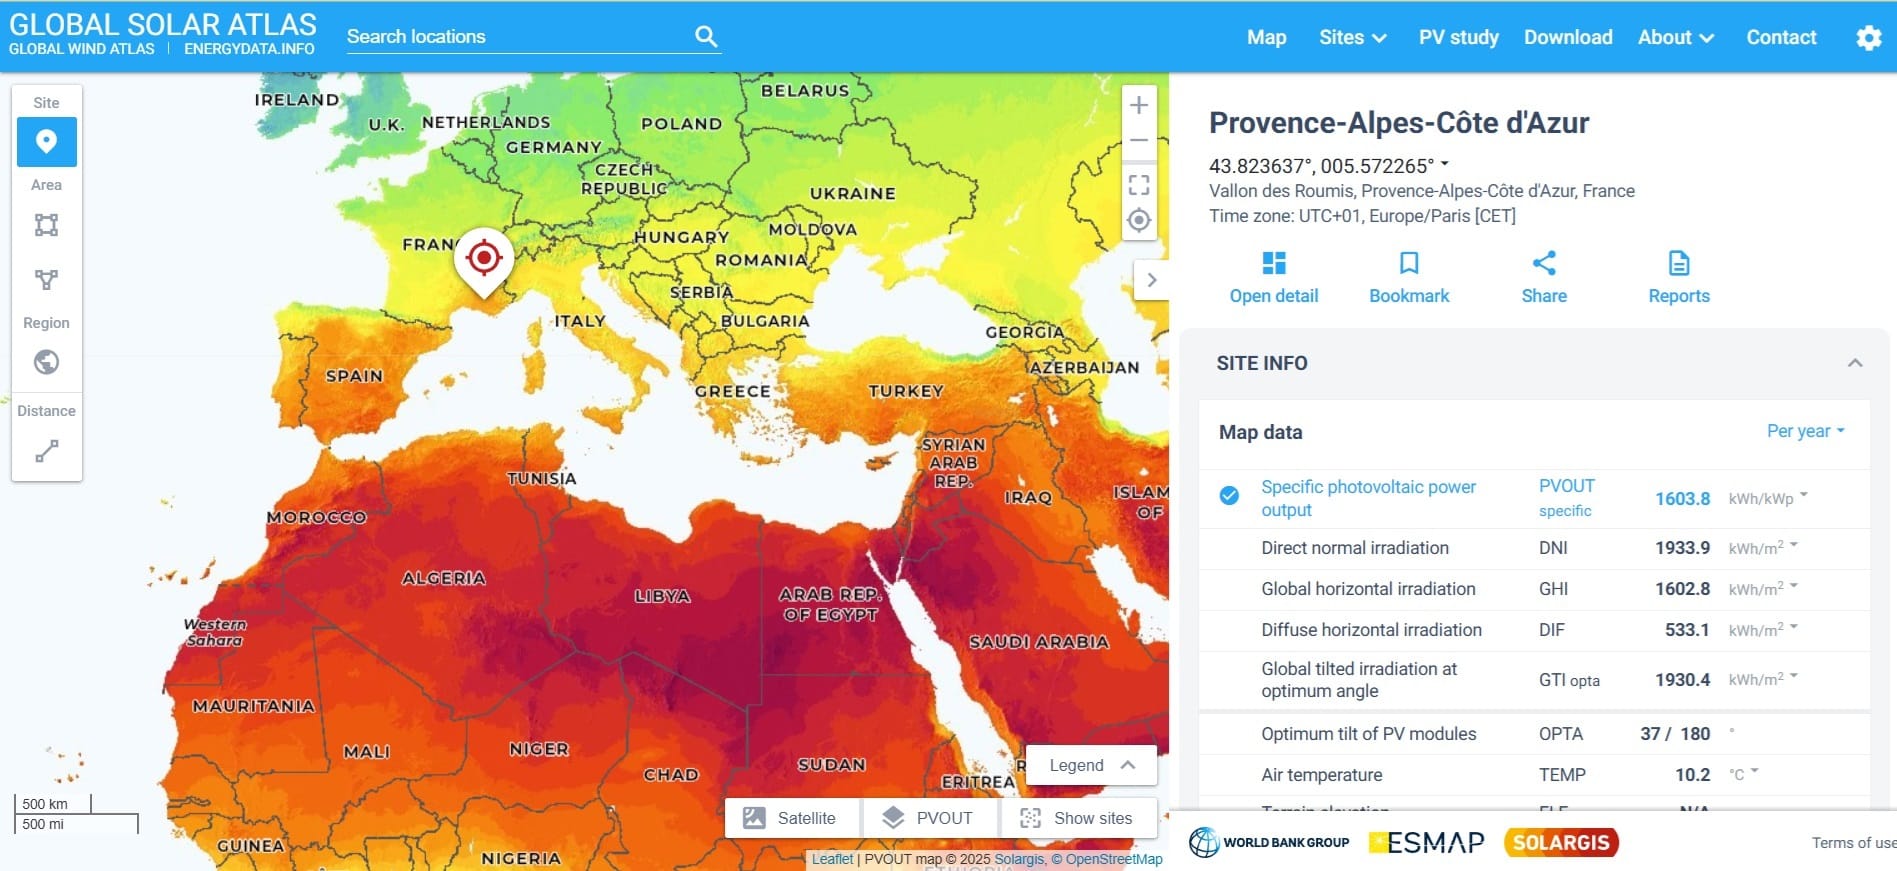
Global Solar Atlas (link)
The Global Solar Atlas (GSA) is a free, online, map-based application that provides information on solar resource and photovoltaic power potential globally. It features the online interactive map tools, simplified photovoltaic (PV) power calculator, reporting tools and the extensive download section. It is intended to provide policy makers, academia, and renewable energy stakeholders to raise awareness in the solar energy domain, support the development of policies and plans, and for initial zoning and site identification purposes.
Tutorials and Useful Guide for Global Solar Atlas:
- User guide (link): Solar resource information presented in the Global Solar Atlas offers an excellent opportunity to do site prospection and pre-evaluation of the potential of solar energy in different countries and areas. Check out how to run your analysis!
- Getting Started (link): Explore all functionalities of Global Solar Atlas.
You can also check out a simulation in the video below:
New European Wind Atlas (link)
The New European Wind Atlas (NEWA) web pages offer educators access to a wide range of wind atlas datasets from the New European Wind Atlas project. This comprehensive project involved the precise mapping of wind conditions, the development and testing of new downscaling methods, and atmospheric field experiments to validate the models. Teachers can use these resources to introduce students to wind energy, meteorology, and environmental science, providing hands-on data for exploring renewable energy and the science behind wind patterns.
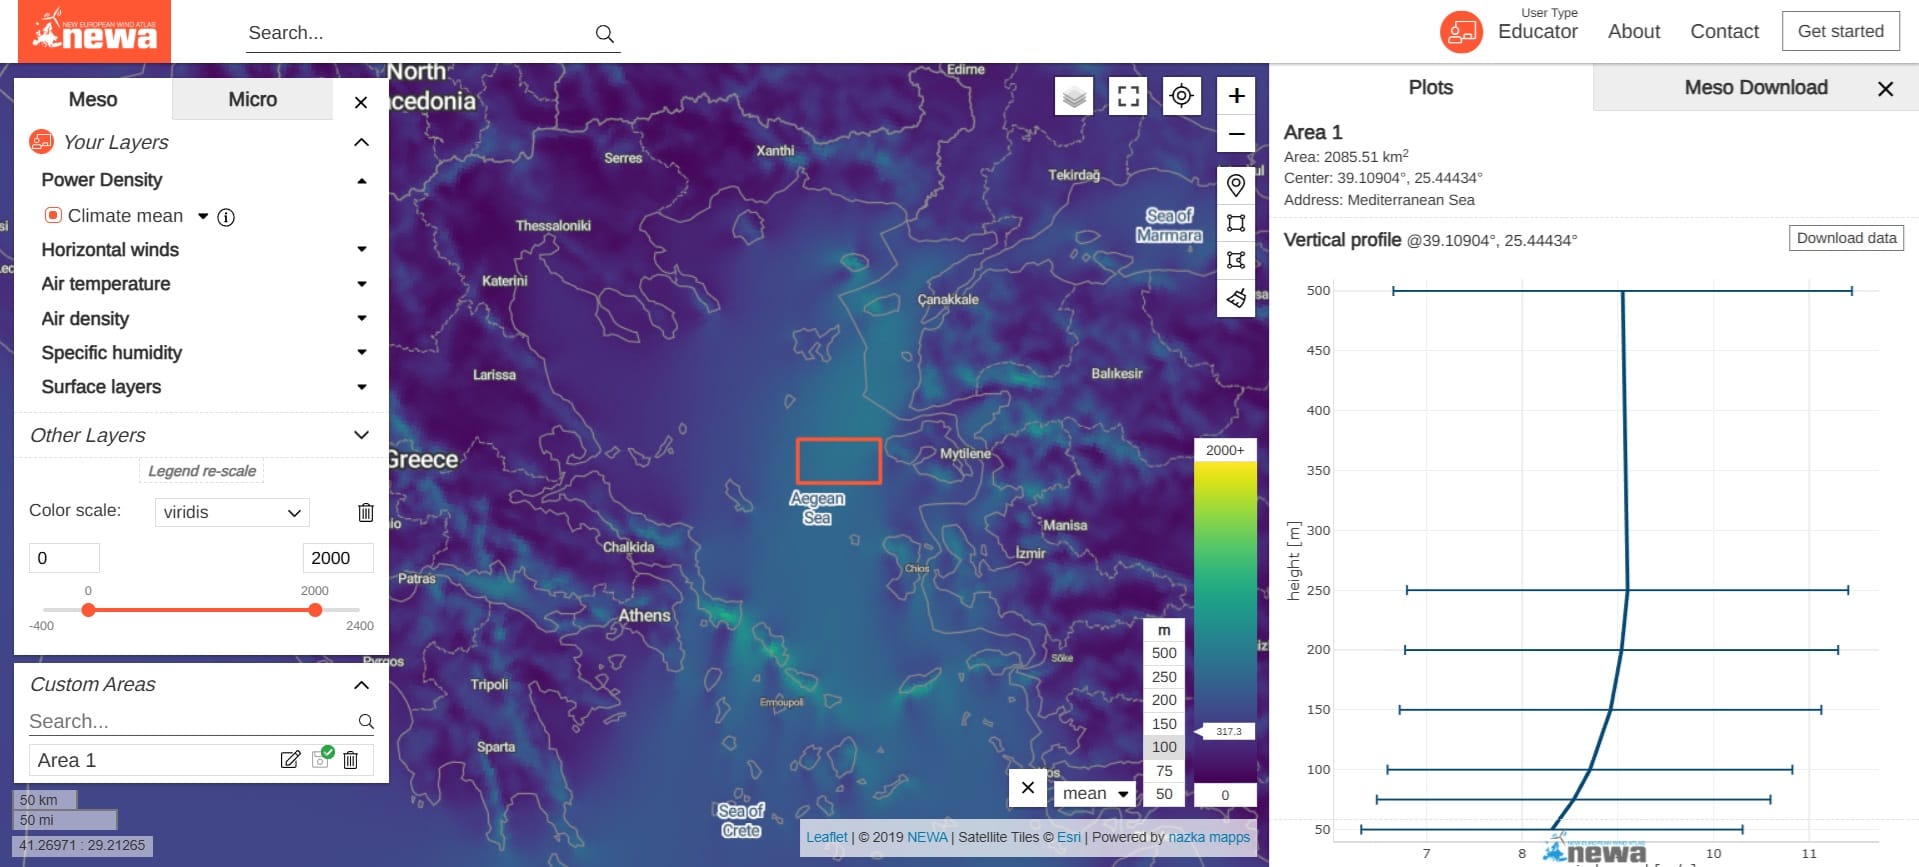
Press the ‘Get Started’ button (see Image above) and explore the full capabilities of the New European Wind Atlas by letting your students identify windy areas, analyze graphs and suggest potential areas for either offshore and onshore wind turbines! Or check the following video with the Gloabal Wind Atlas (similar to the New European Atlas) capabilities!
4. 3D Visualization Tools
3D visualization tools add depth and realism to spatial data, allowing for the creation of detailed models of landscapes, cities, and infrastructure. These tools are particularly valuable in urban planning, architecture, environmental studies, and disaster risk management, where understanding spatial relationships in three dimensions enhances analysis and decision-making.
Examples of 3D visualization tools include:
- Cesium – A web-based platform for creating dynamic 3D maps and globe visualizations.
- Google Earth Pro – A widely used tool for visualizing terrain, built environments, and geographic features.
- ArcGIS 3D Analyst – Provides 3D modeling capabilities within the ArcGIS ecosystem.
These GIS tools empower educators to integrate spatial data into their lessons, helping students develop critical thinking skills and a deeper understanding of geographic concepts.
Cesium (link)
Cesium is the open platform for software applications designed to unleash the power of 3D data. Offering a mix of open source and commercially available software, the Cesium platform is a complete suite of tools for building 3D geospatial applications of any kind.
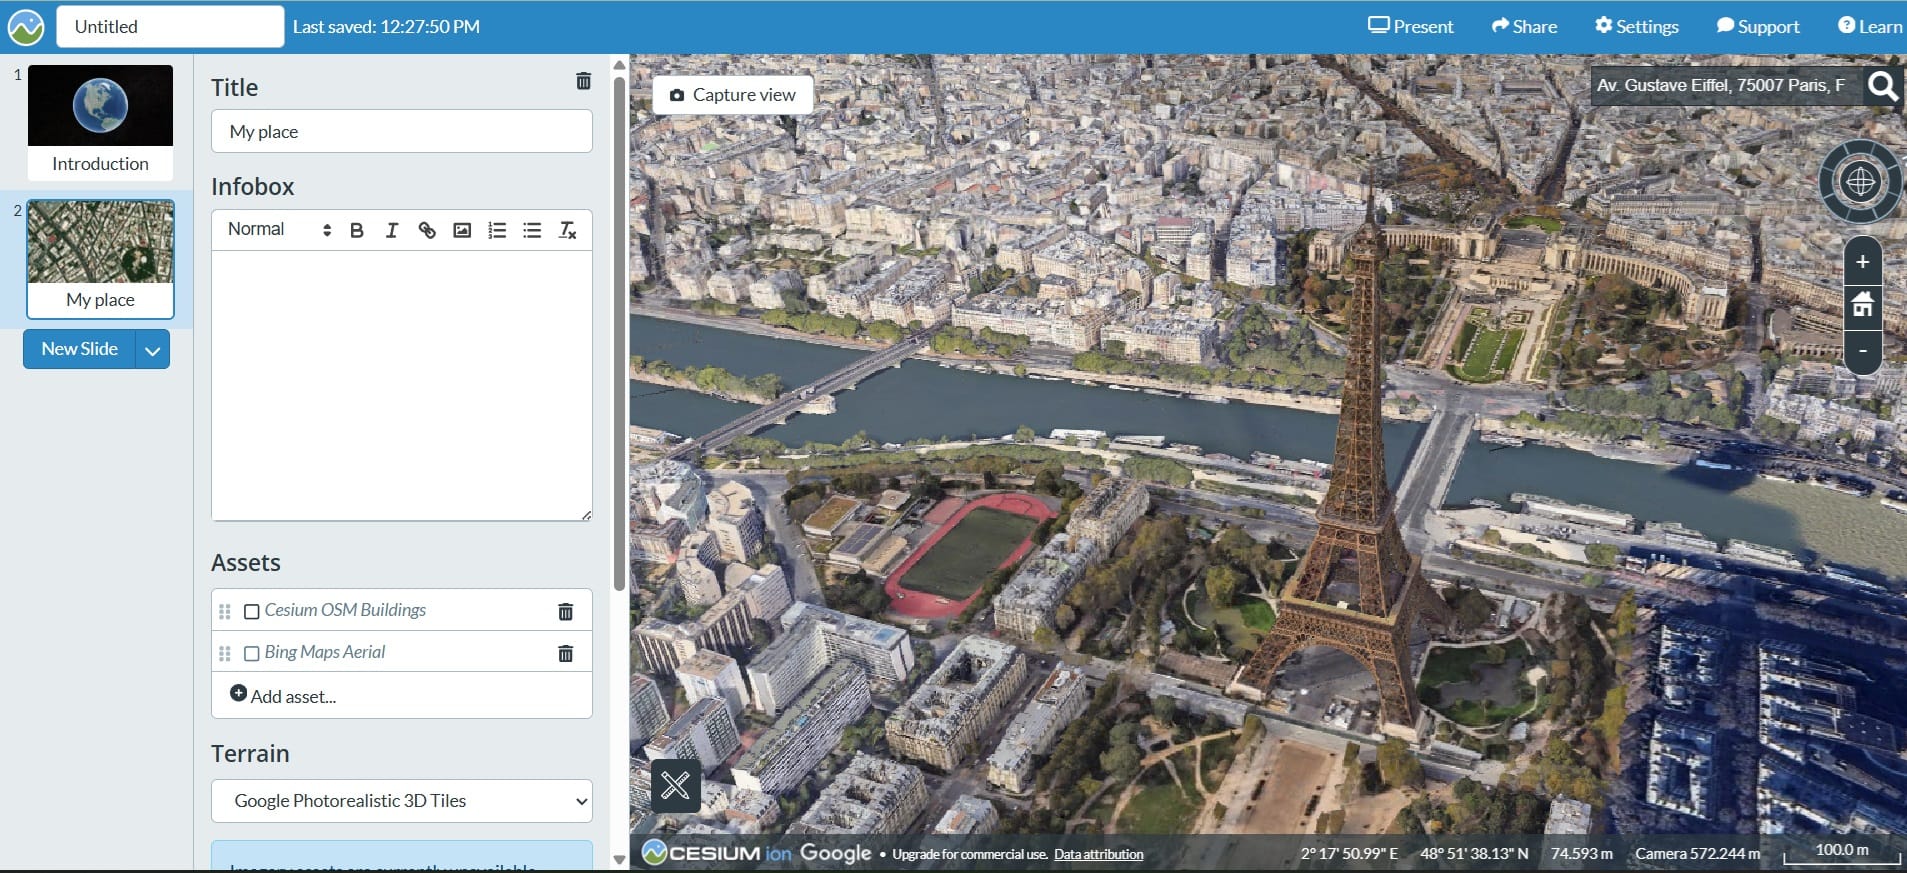
Your students may Create Interactive 3D Presentations with Cesium Stories in a simple way!
Useful Resources:
- Create an Interactive 3D Presentation Tutorial (link): This tutorial will walk you through how to use Cesium Stories to create an interactive 3D presentation showing how Melbourne tracks pedestrian activity.
- Cesium for Unreal Quickstart (link): This is a quickstart guide to building a Cesium for Unreal app with Cesium World Terrain and Cesium OSM Buildings.
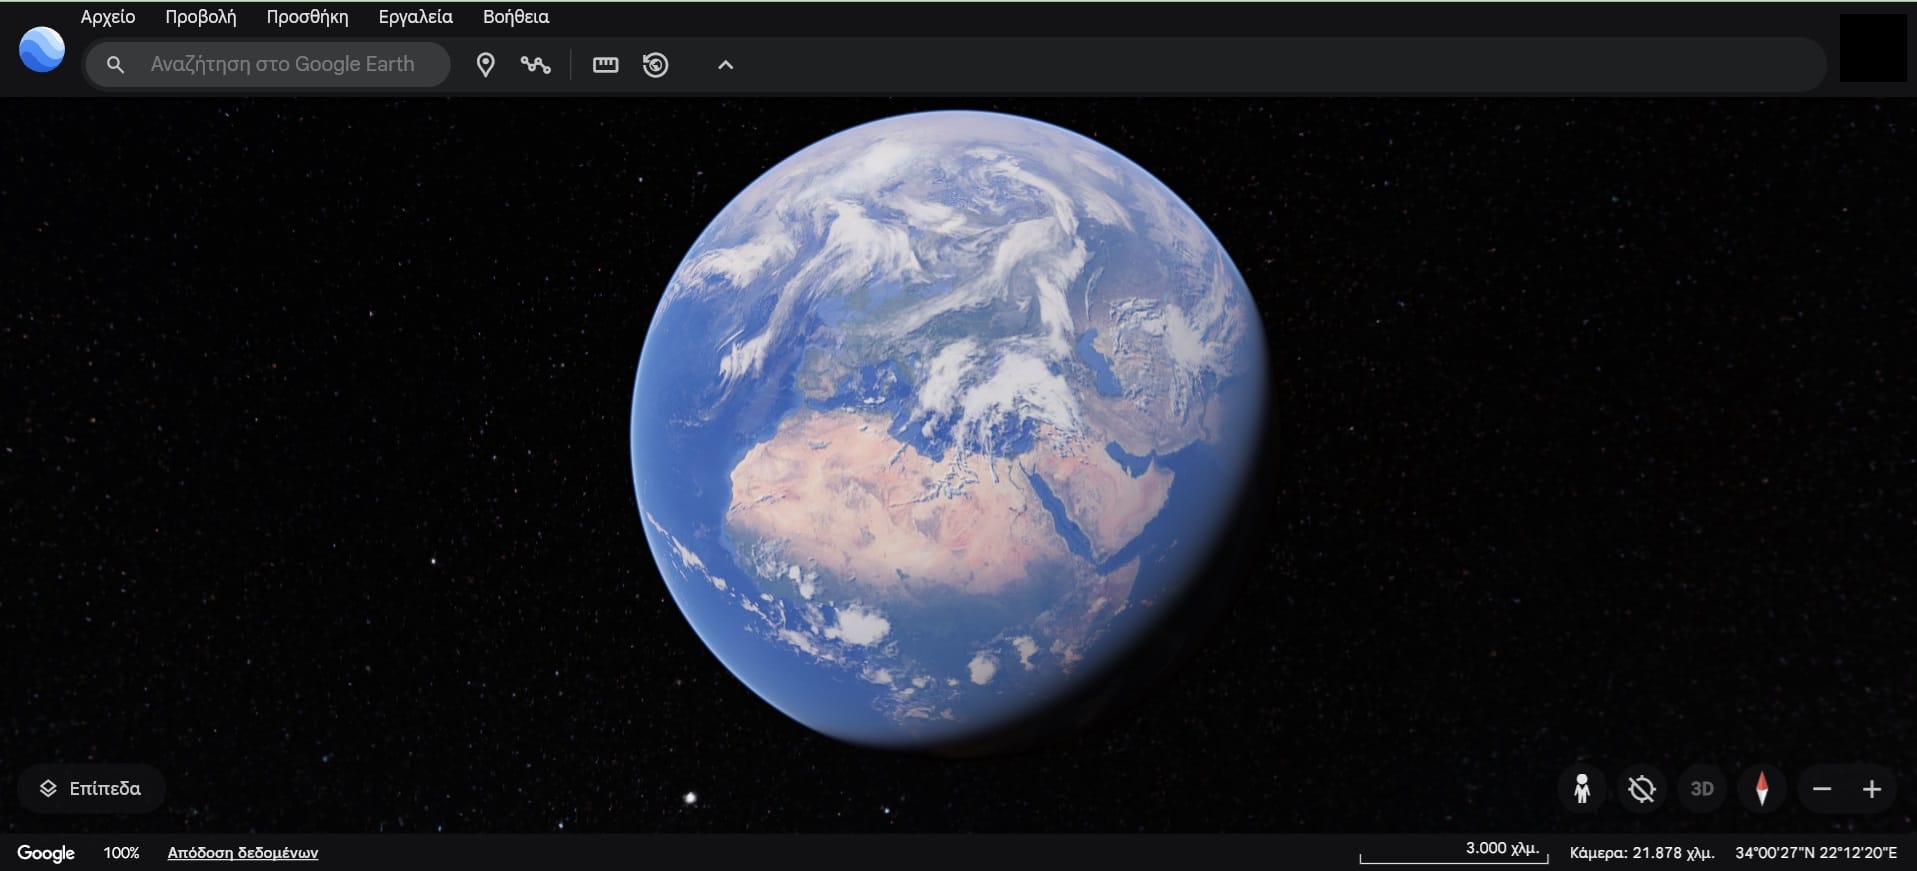
Google Earth Pro (link)
Google Earth Pro is the oldest and original version of Google Earth. It is free of charge and can be installed on a Windows, Mac or Linux computer. Be sure to click the “Download Earth Pro on desktop” button in the middle of the screen. If you need the web version, press “Launch Earth” button.Once Google Earth Pro is installed you will find it in the Windows start menu or the Mac Applications folder. Google Earth Pro is still being maintained and updated.
Useful resources on how to use Google Earth Pro:
Useful links
- QGIS: Training Manual
- QGIS: Tutorials and Tips
- QGIS: Learning Resources
- ESRI: ArcGIS Pro quick-start tutorials
- ESRI: Resources for teaching with ArcGIS Pro
- ESRI: Teacher resources
- MapMaker: Collection of educational resources
- MapMaker: GeoInquiries
- Google Maps: Help – How to use Google Maps
- Google Maps: Features that help me navigate more confidently
- Copernicus: About the Platform – Tutorial
- Copernicus: Back to School with Copernicus Browser
- Copernicus: Video of Teaching Geography with Satellite Imagery
- EMODnet: The EMODnet Map Viewer, your tool to data discovery
- Global Solar Atlas: User guide
- Global Solar Atlas: Getting Started
- Cesium: Create an Interactive 3D Presentation Tutorial
- Cesium: Cesium for Unreal Quickstart
- Google Earth Pro: Tutorial for Desktop
- Google Earth Pro: User Guide