Download vector data
Introduction to Downloading Vector (Shapefile) Data
In GIS, vector data represents geographic features using points, lines, and polygons. One of the most common formats for storing and sharing vector data is the Shapefile (.shp), which is widely supported by GIS applications like QGIS.
In this lesson, we will explore how to find and download shapefile data from reliable online repositories. You will learn how to identify datasets relevant to your project, download them in the correct format, and prepare them for use in GIS software. Understanding how to access and manage vector data is essential for mapping, spatial analysis, and environmental studies.
By the end of this lesson, you will be able to:
✅ Locate trusted sources for shapefile data.
✅ Download vector datasets and extract the necessary files.
✅ Load and visualize shapefiles in QGIS.
Let’s get started by exploring where to find quality shapefile data!
In this lesson we will work for Cyprus and we will try to identify online data either in vector format (shapefiles) or raster format (tiff or geotiff files). Let’s start with some administrative units and marine boundaries data.
Step 1: Administravite units of Cyprus (Level-0, Shoreline and Level-1, Administrative districts)
a) The first option to download Cyprus coastline is via MarineRegions.org
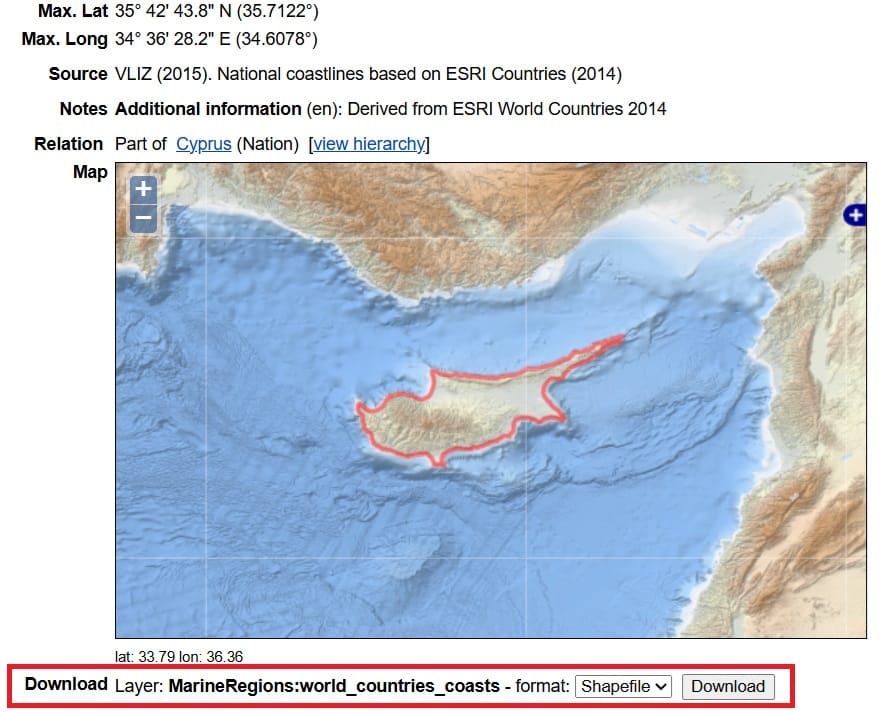
We scoll down on the Marineregions.org website and in the ‘Download’ option we select the ‘Shapefile’ format and then > Download
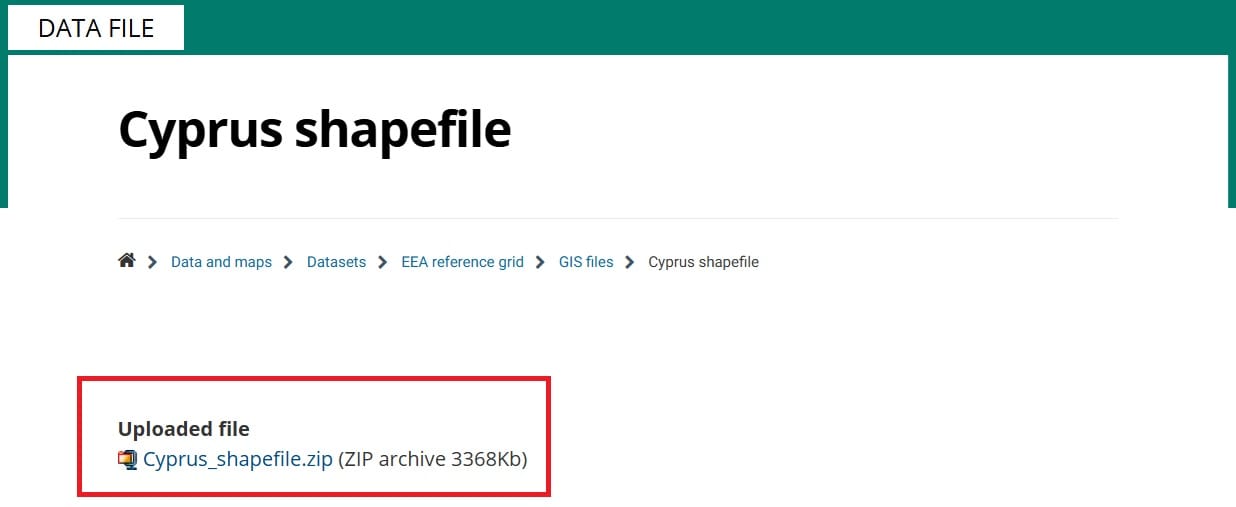
b) Another option is to use the European Environmental Agency (EAA) spatial data repository by clicking on the ‘Cyprus_shapefile.zip’ file
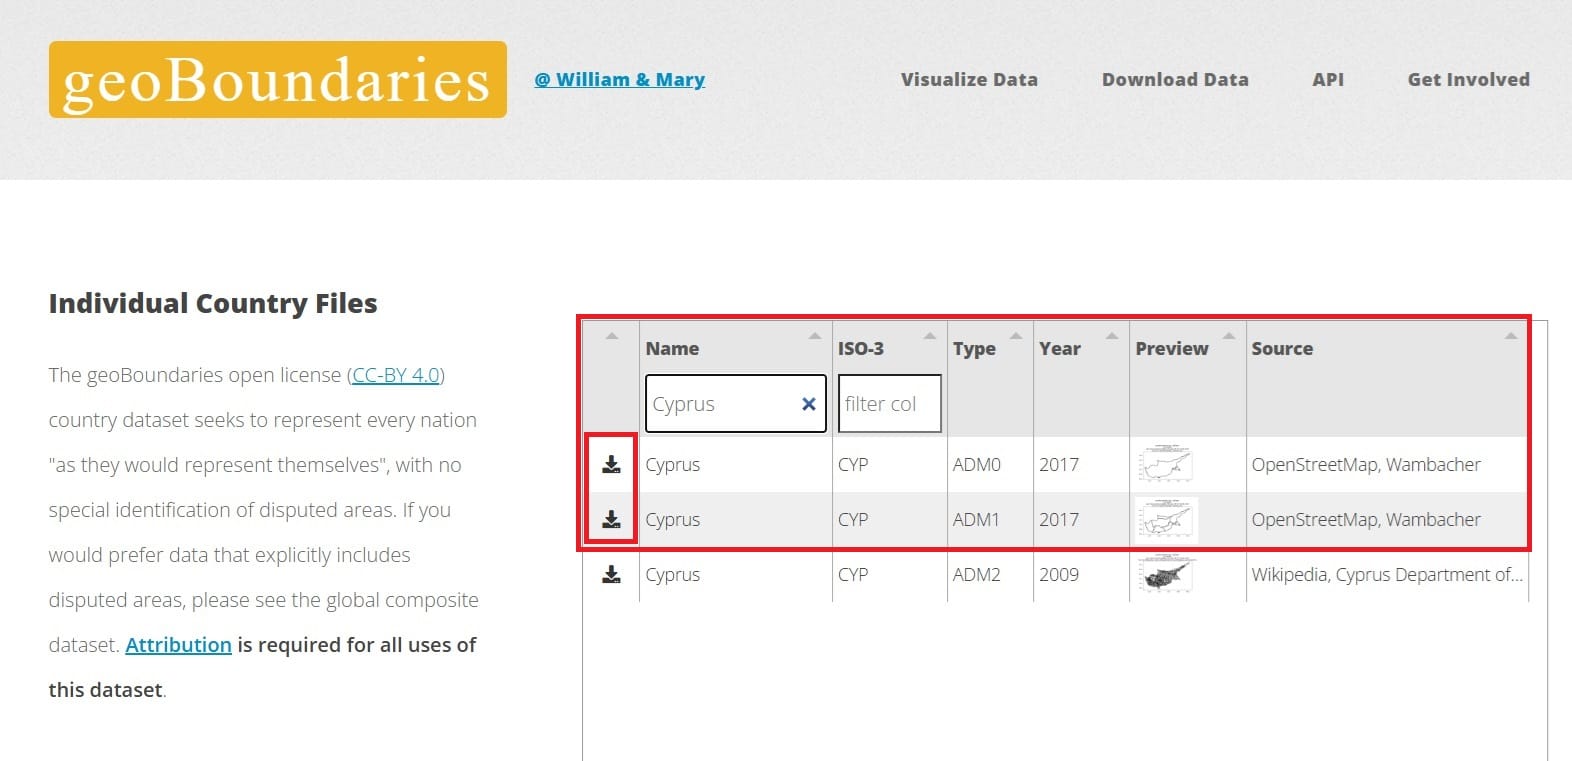
c) We may also use geoBoundaries (again)! We are just typing the name of the country we are looking for and the > the download button for both files!
For our exercise, let’s try option 1a and 1b!
Step 2: Marine boundaries (Exclusive Economic Zone) of Cyprus
Next, we will also download the Exclusive Economic Zone (EEZ) of Cyprus, in case we want to cut or clip other data only for the marine areas of Cyprus. To do that, we will visit the Marineregions.org.
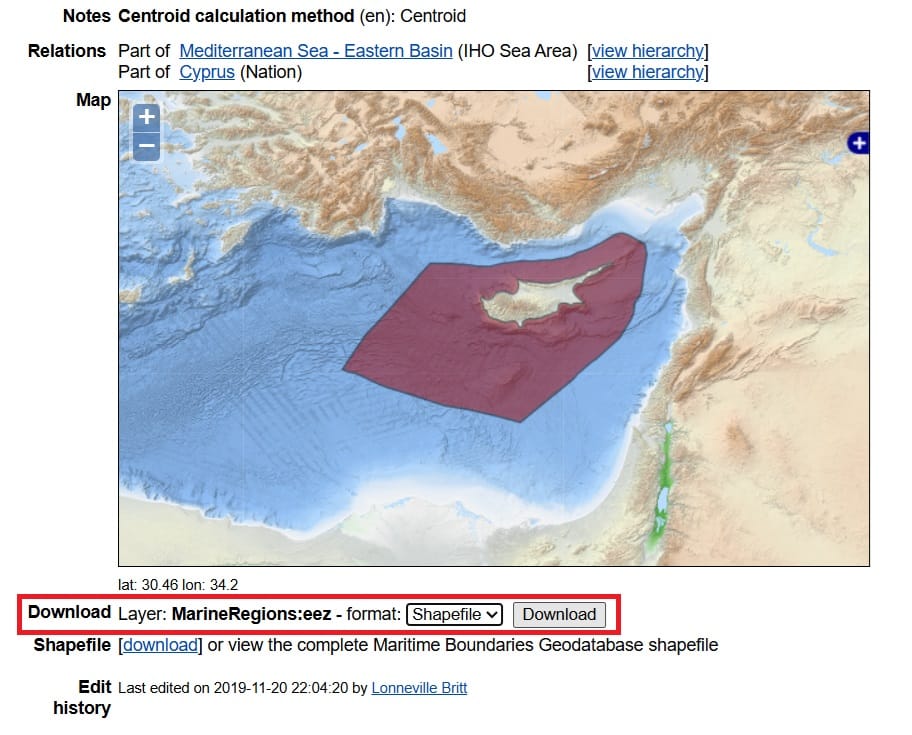
We scoll down on the Marineregions.org website and in the ‘Download’ option we select the ‘Shapefile’ format and then > Download
Step 3: Open Street Map (OSM) Data
In order to download some Open Street Maps (OSM) data for Cyprus, we will use BBike application where you can download all buildings (in polygons), the road network (in lines) and important public facilities (in points).
Firts we have to zoom in on a city of Cyprus, for example, Limassol. Unfortunately, using BBike we cannot download OSM data at country level however, we can select some areas.
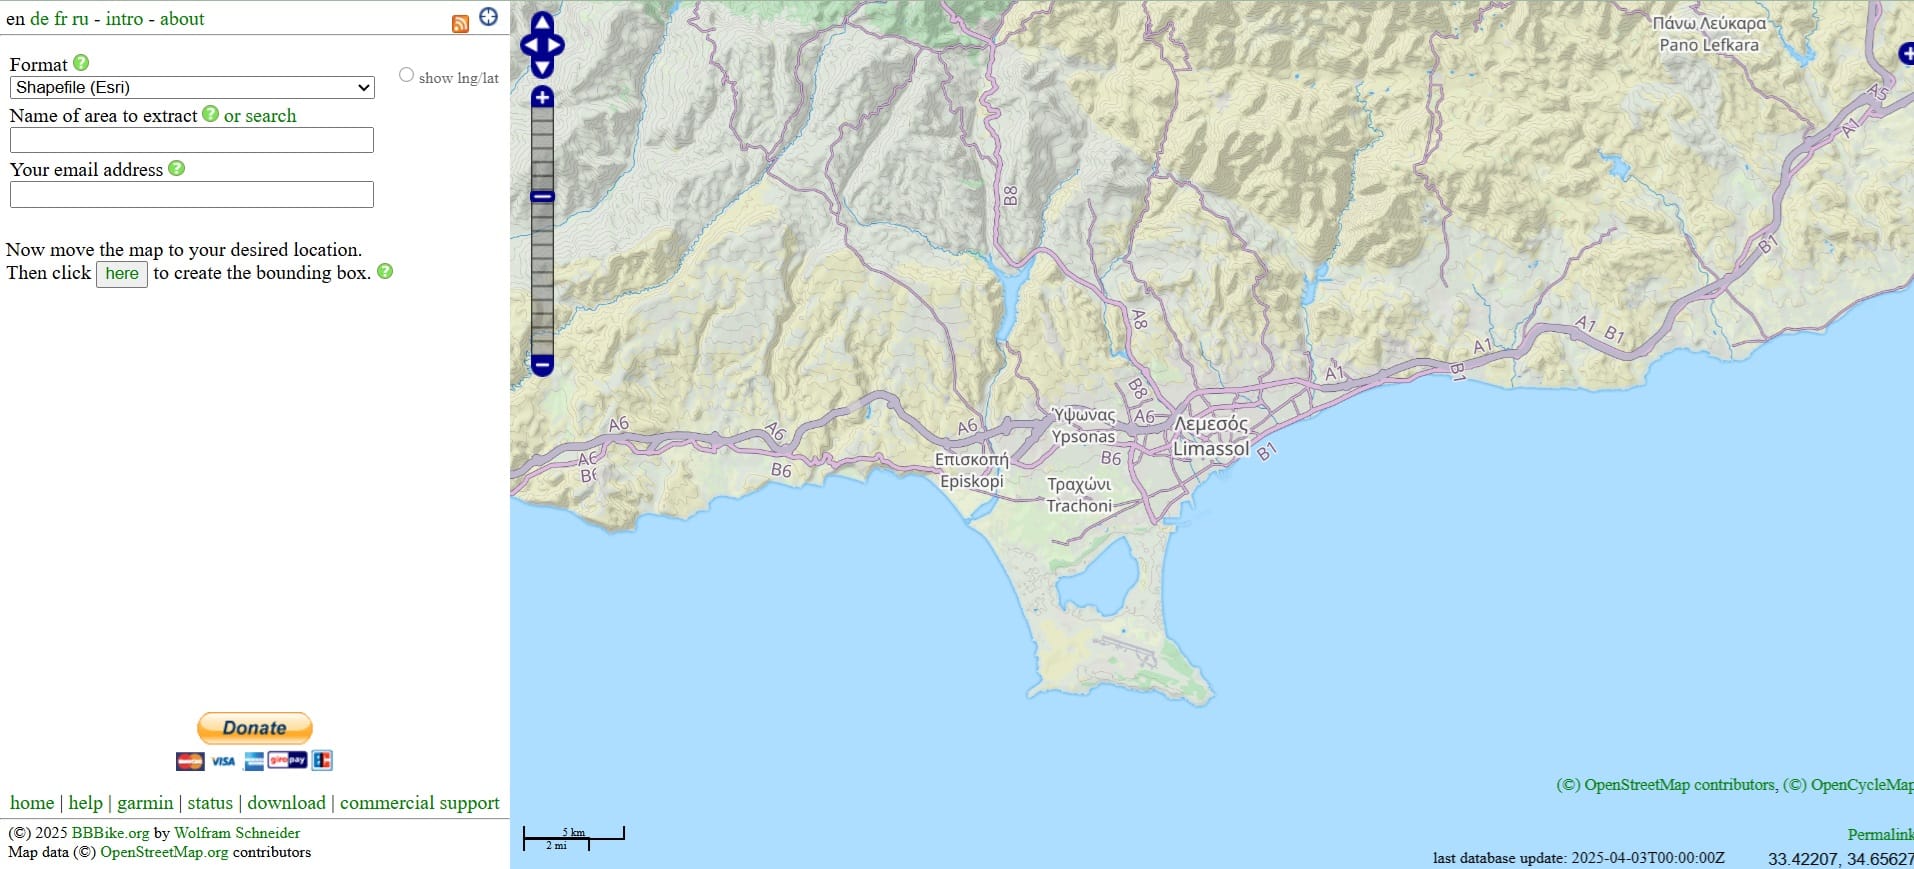
In order to download the OSM data, we have to define a processing extent (a polygon) in which we want to extract data! To do that, we first select ‘Then click here to create the bounding box’.
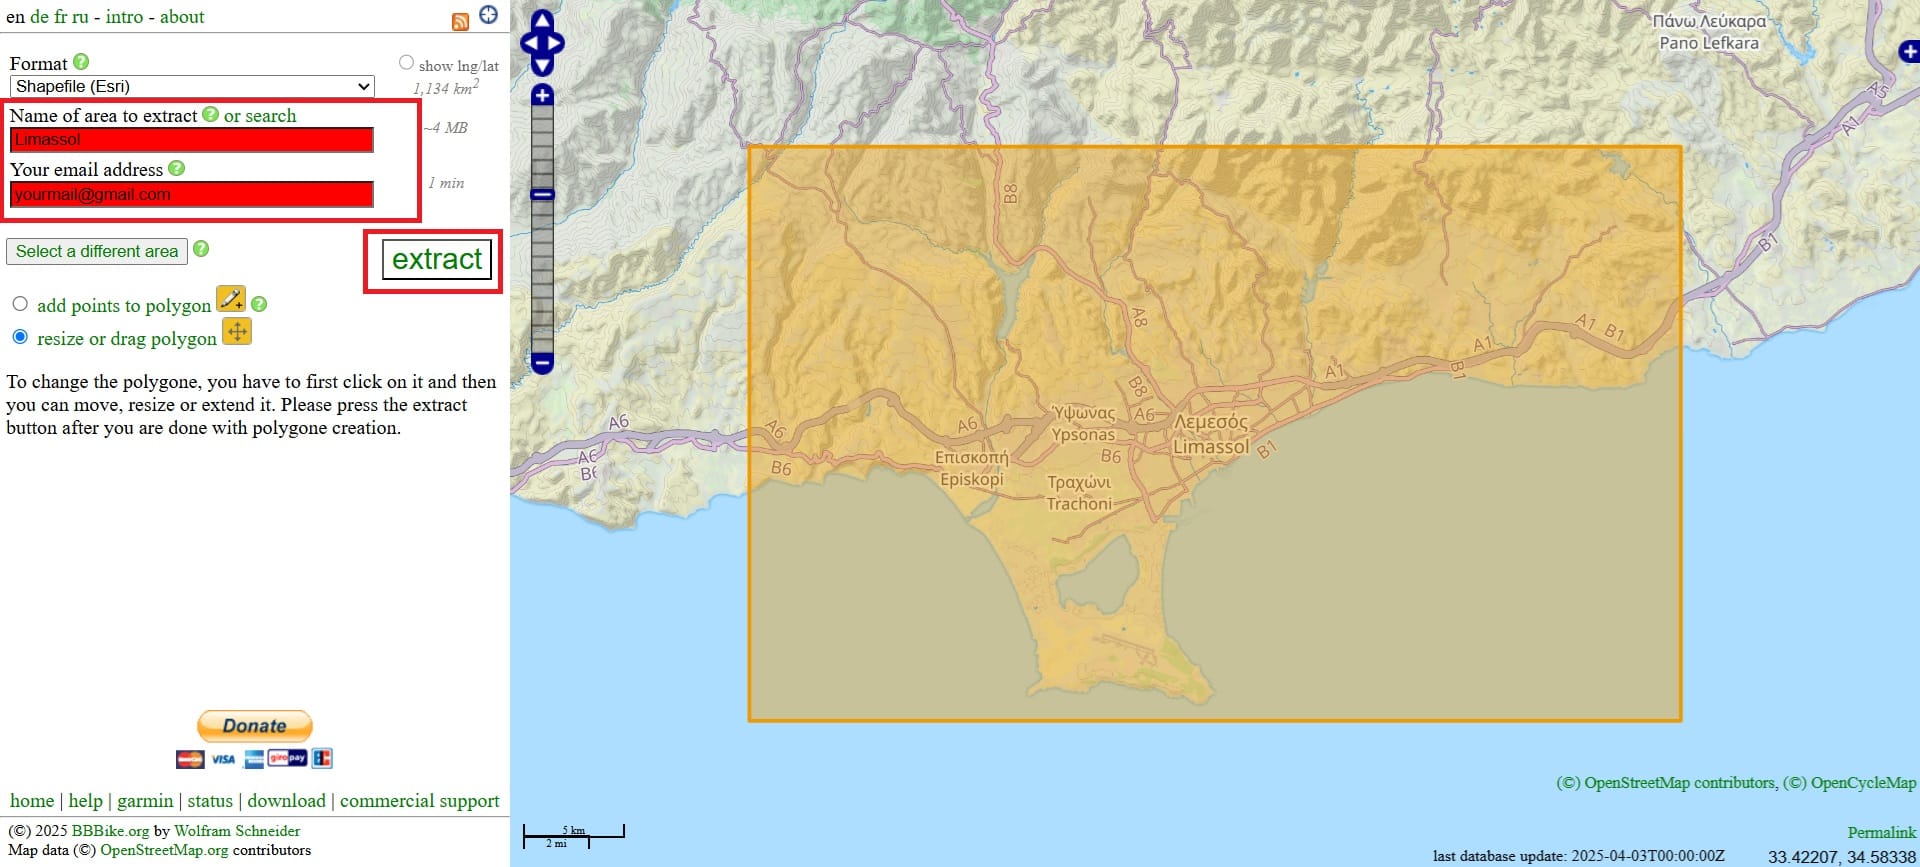
Then, a polygon will appear! We can move the polygon, change its size or reshape it by adding points. Next, we should give a name to the area we want to extract (red box) and also, to give our email (red box) because tha shapefile data will be directly sent to our email account.
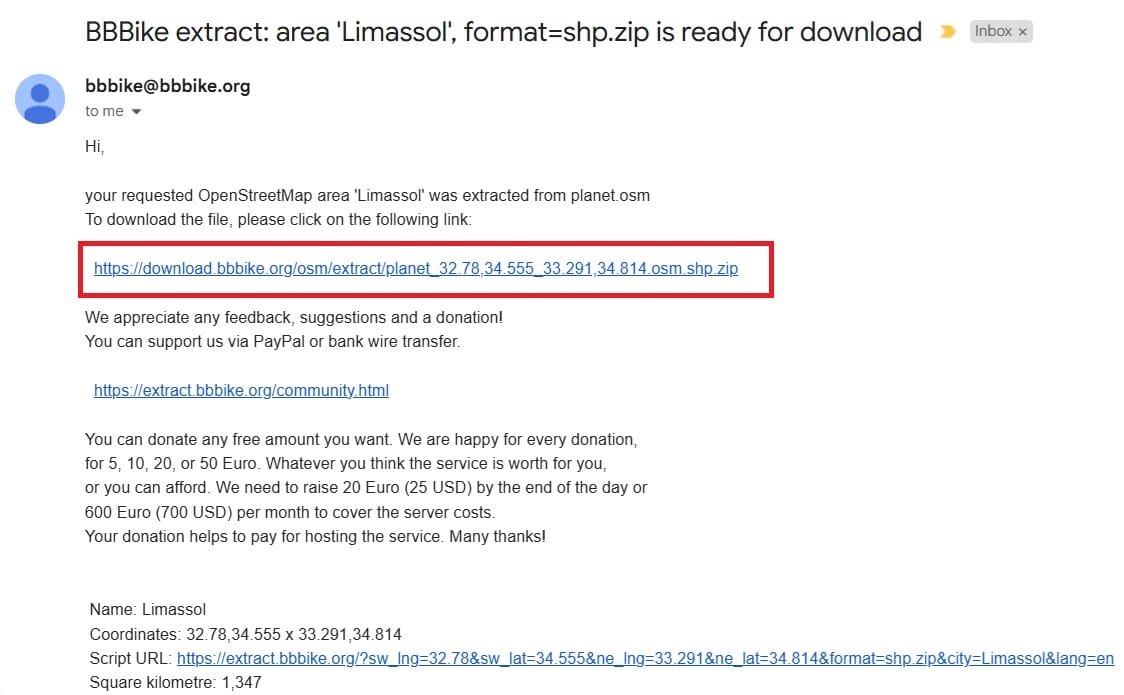
After a couple of minutes we will receive an email with the Download link (see the image below)!
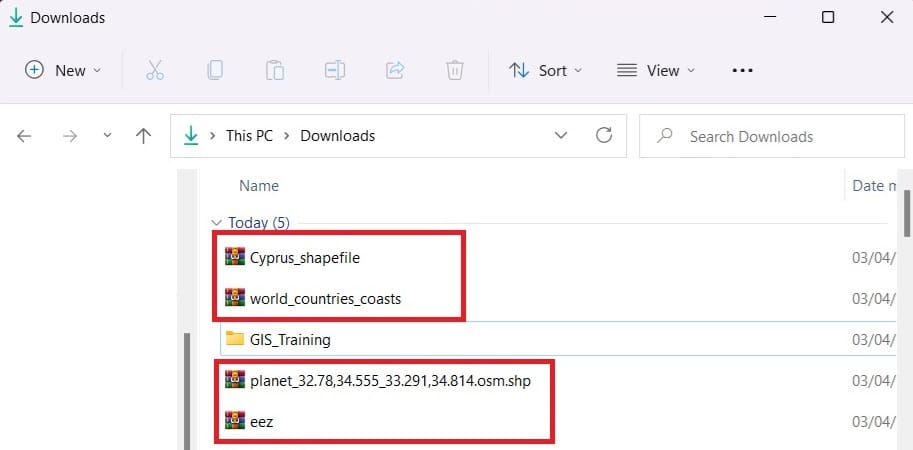
Step 4: Next step is to unzip all the data we have downloaded and add copy (or cut) them to a new folder (i.e. ‘GIS_Training’)!
Step 5: Let’s try to load the data on QGIS Platform!
Press ‘Start’ (the Windows button) on your computer, scroll down on your programs and double-click on the ‘QGIS Desktop 3.40.5’
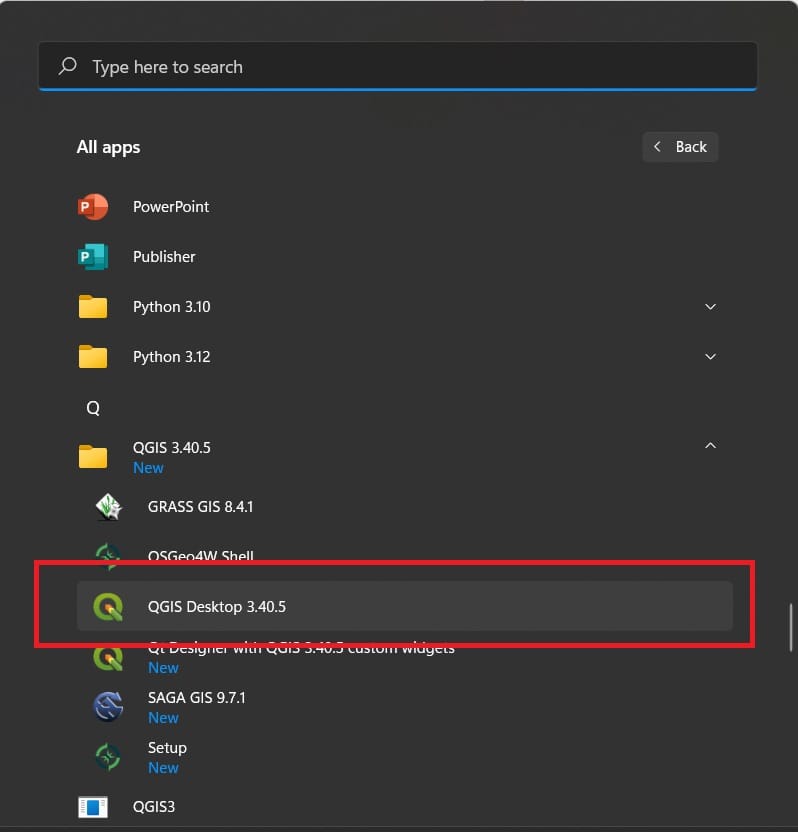
Then the QGIS program will start loading until you see the following screen.
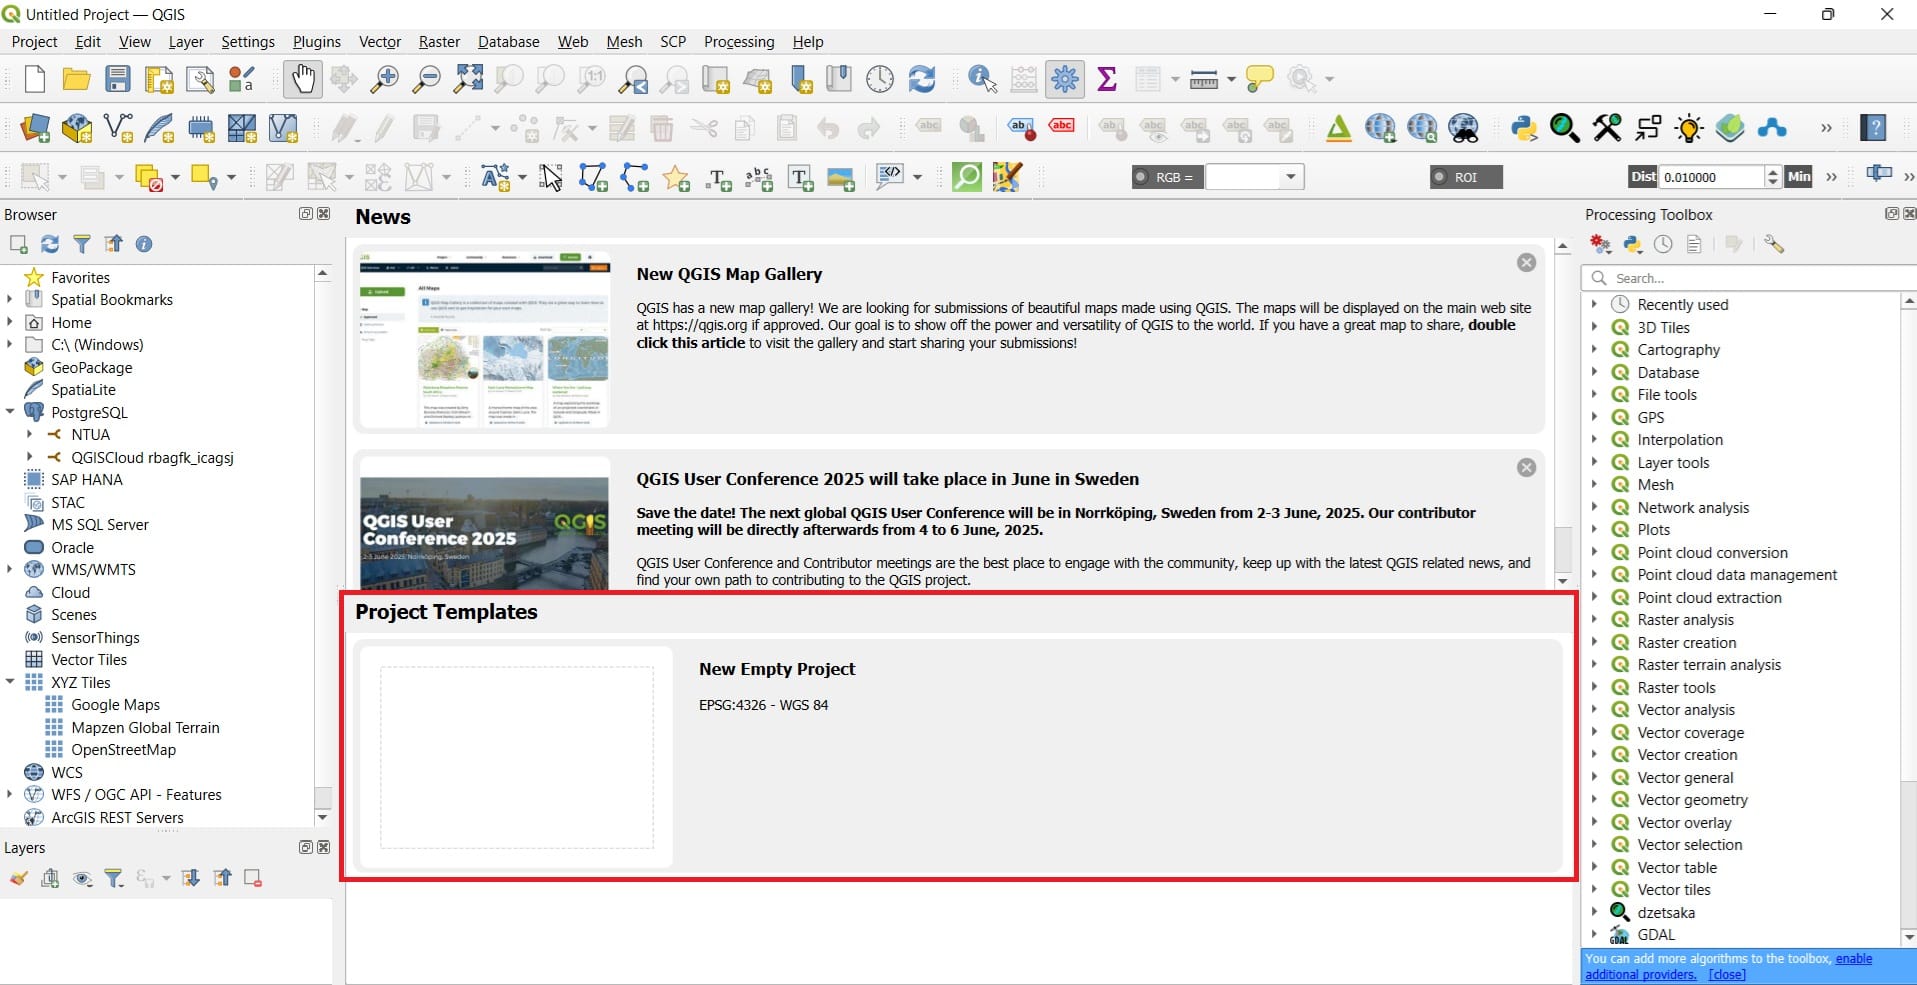
Step 6: Create a ‘New Empty Project’
Let’s start creating our new project! After you enter the QGIS Platform and press the ‘New Empty Project’ you will see the folowing screen!
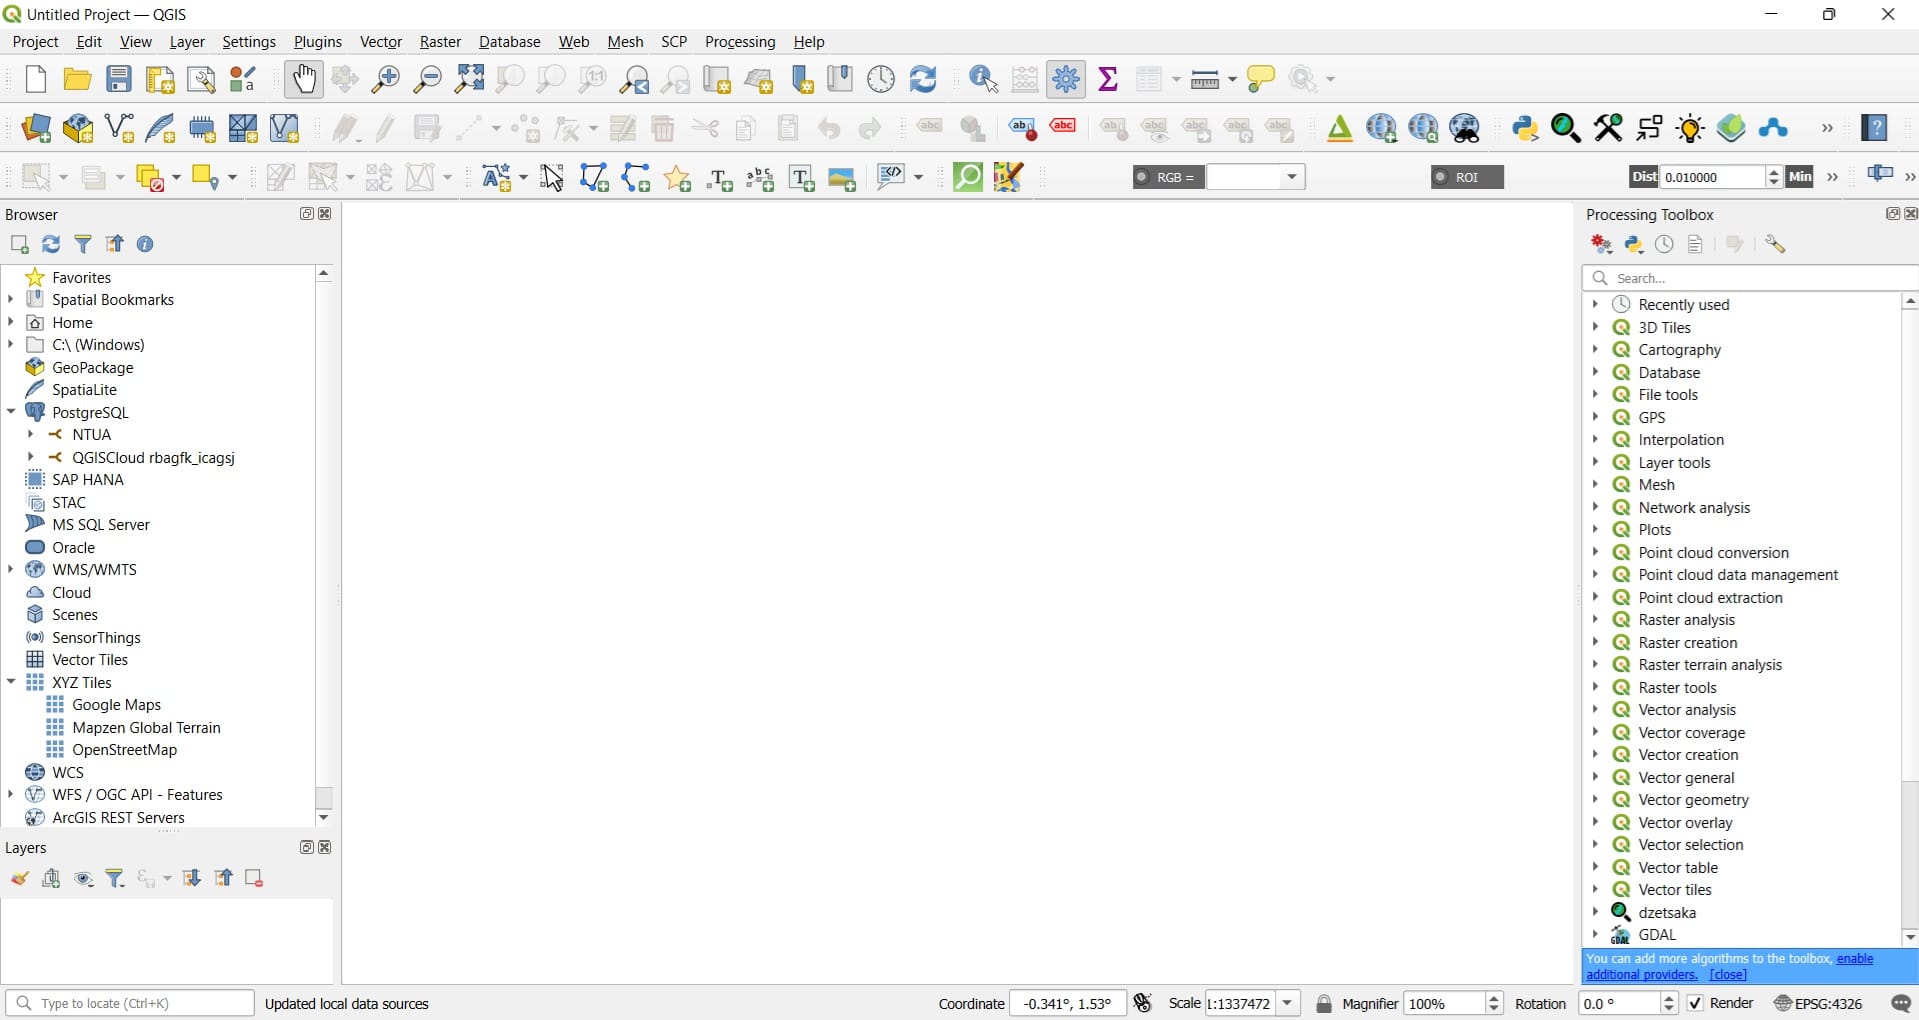
As we mentioned in the QGIS Lesson, we should focus on the ‘Main Toolbar’ (blue box), the ‘Project Toolbar’ (red box), the ‘Layers Window’ (yellow box), and the ‘Processing Toolbar’ (purple box)!
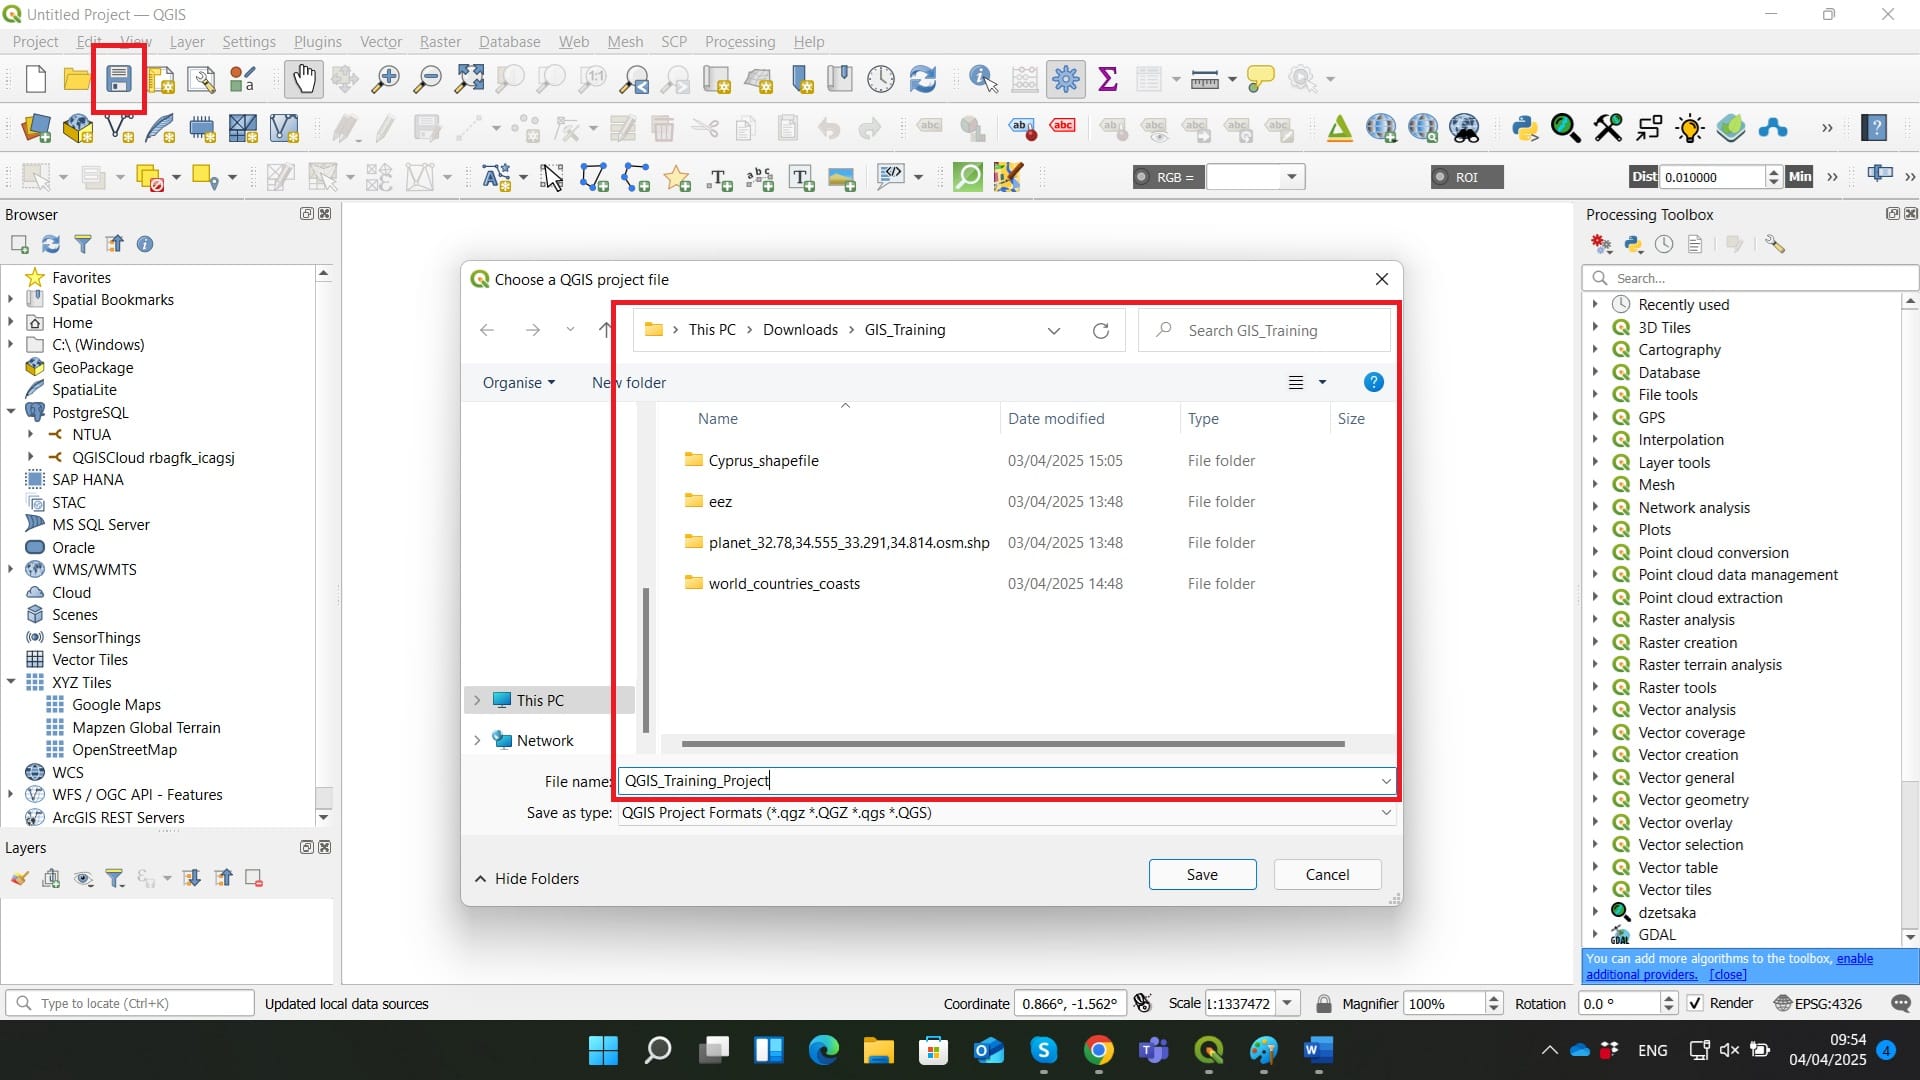
Let’s save our project before we start doing any further actions!
You can select the ‘Save Button’ on the ‘Project Toolbar’ (red box) and then > Save your project in the ‘GIS_Training’ folder we have created with all of our data.
Step 7: Load all vector data we have downloaded!
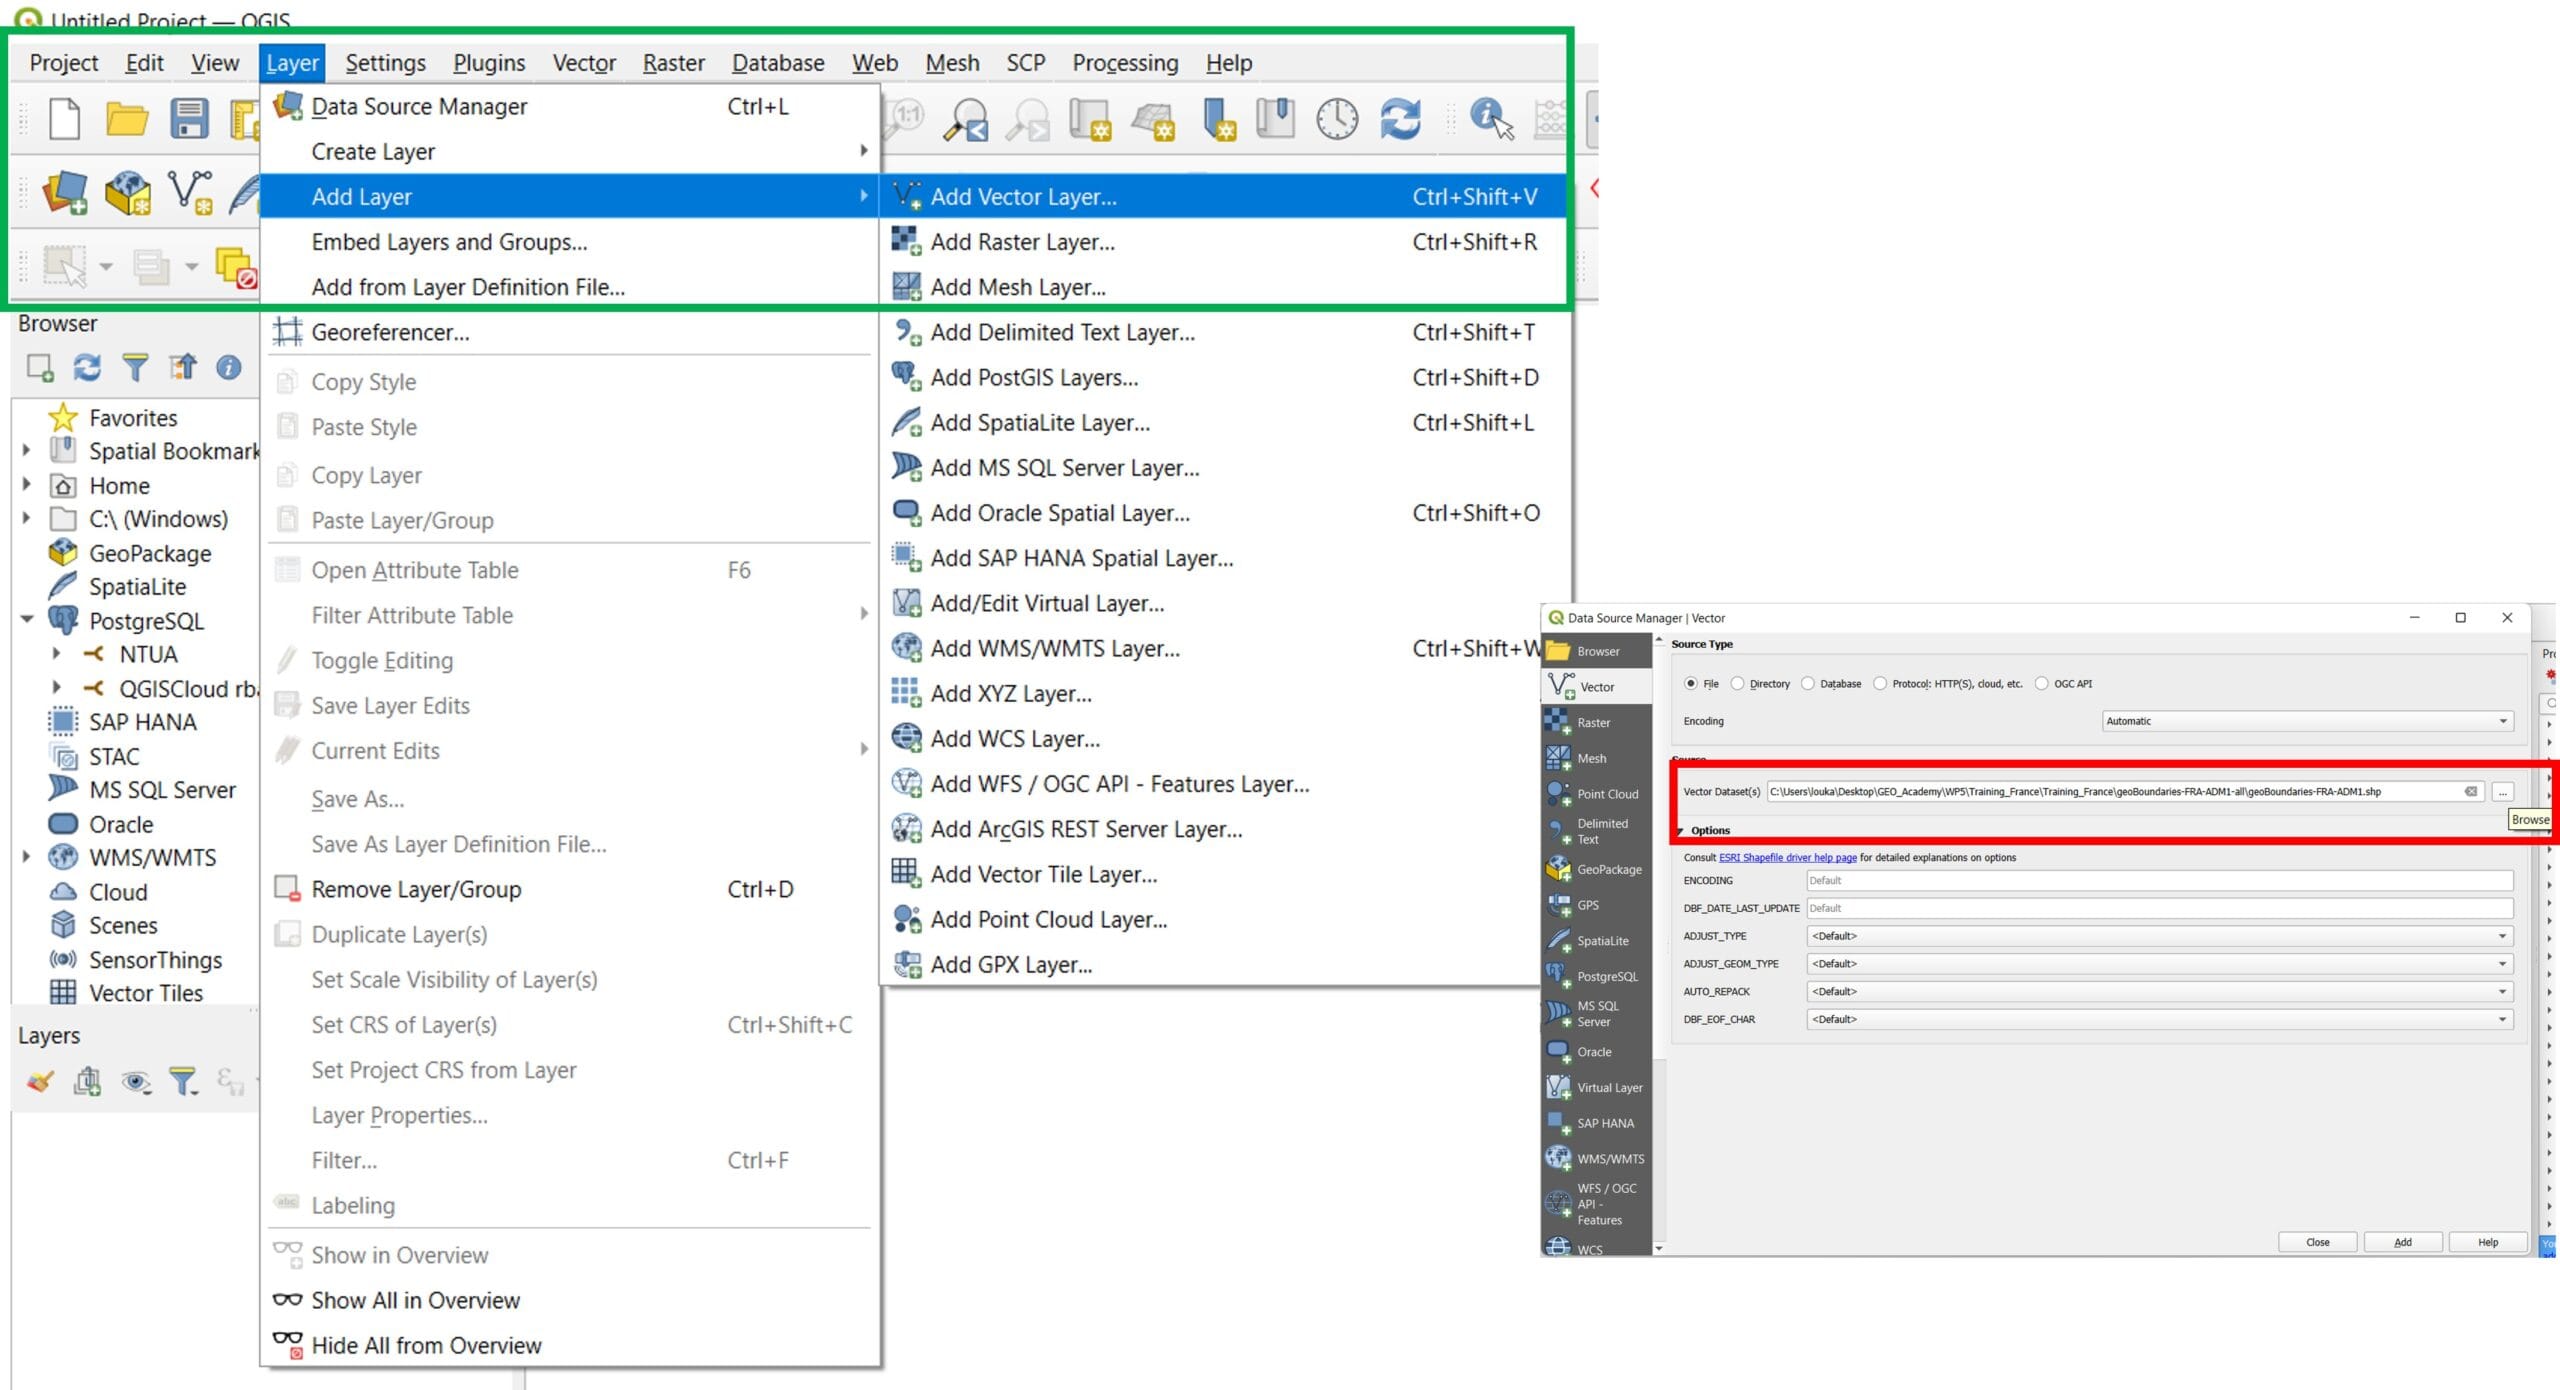
In order to load our first shapefile data, we will use on the ‘Main Toolbar’ > Tab ‘Layer’ > ‘Add Layer’ > ‘Add Vector Layer’
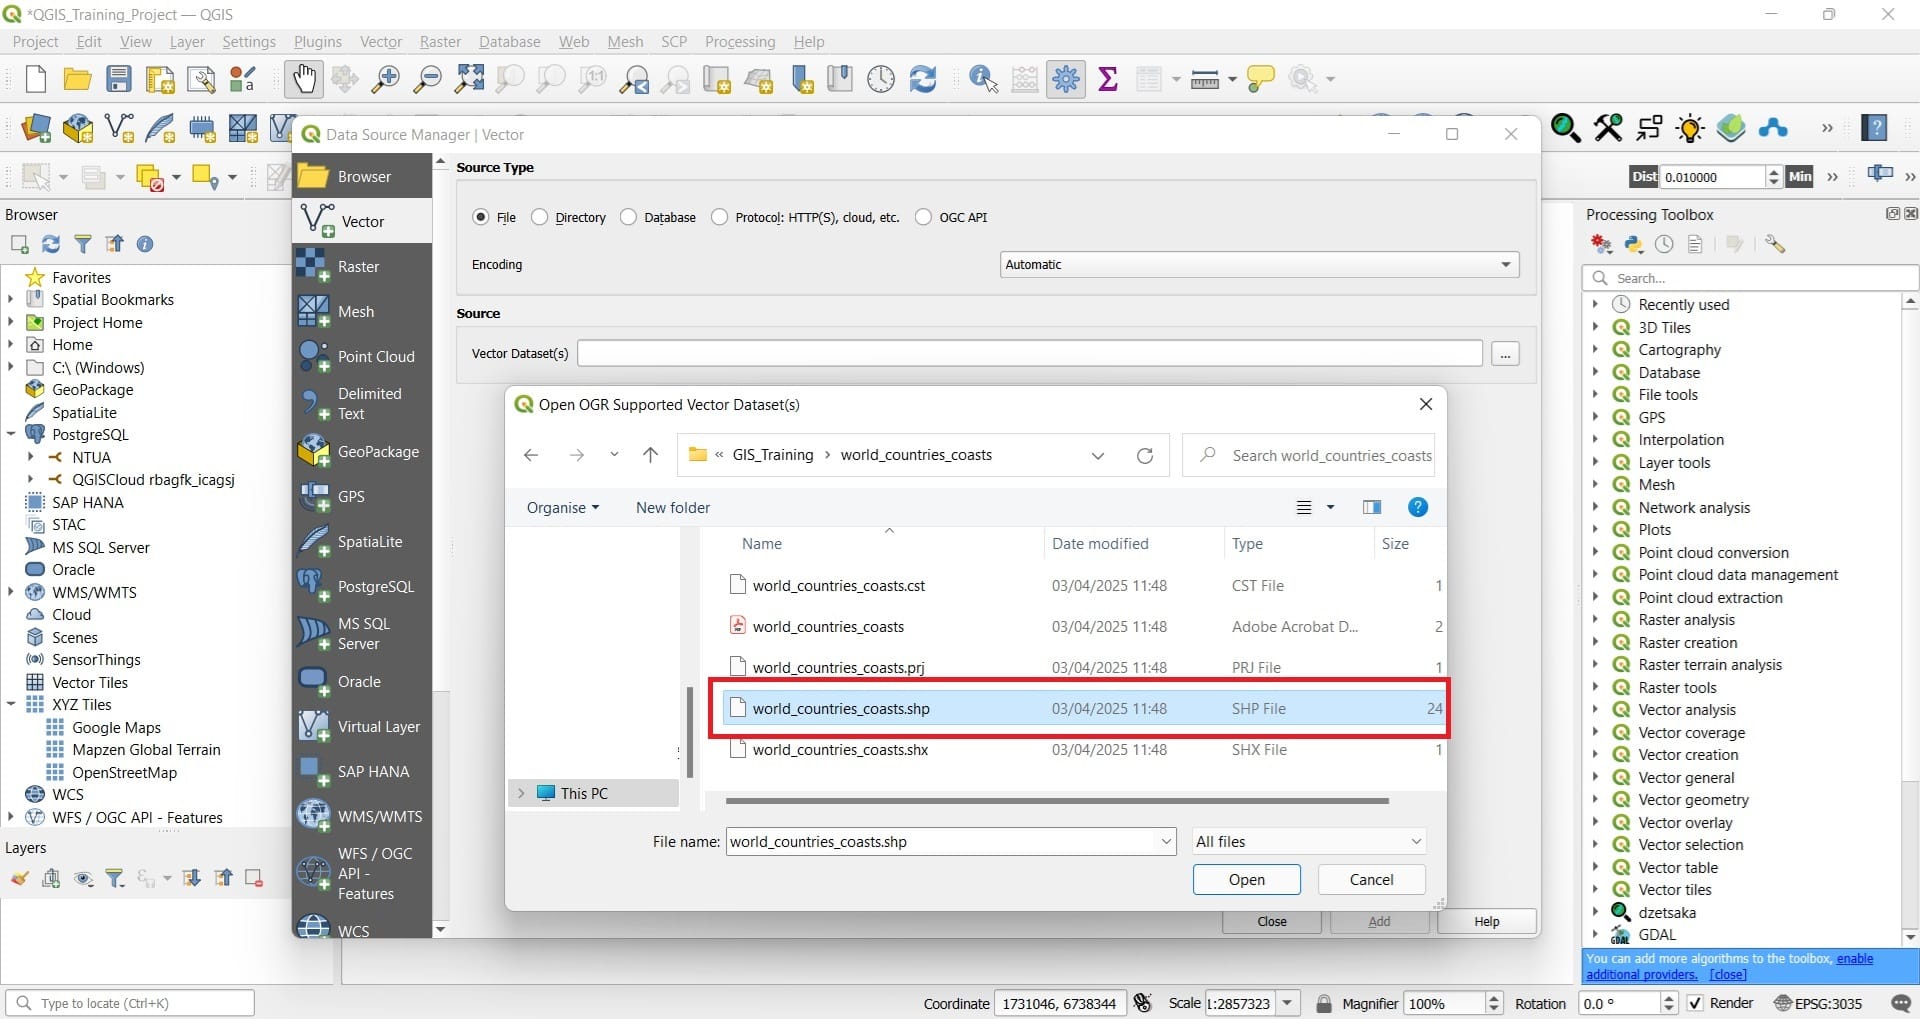
Navigate to all the shapefile folders (i.e. ‘eez’, ‘world_countries_coasts’, ‘planet_32.78,34.555_33.291,34.814.osm.shp’) and select the ‘.shp’ file format!
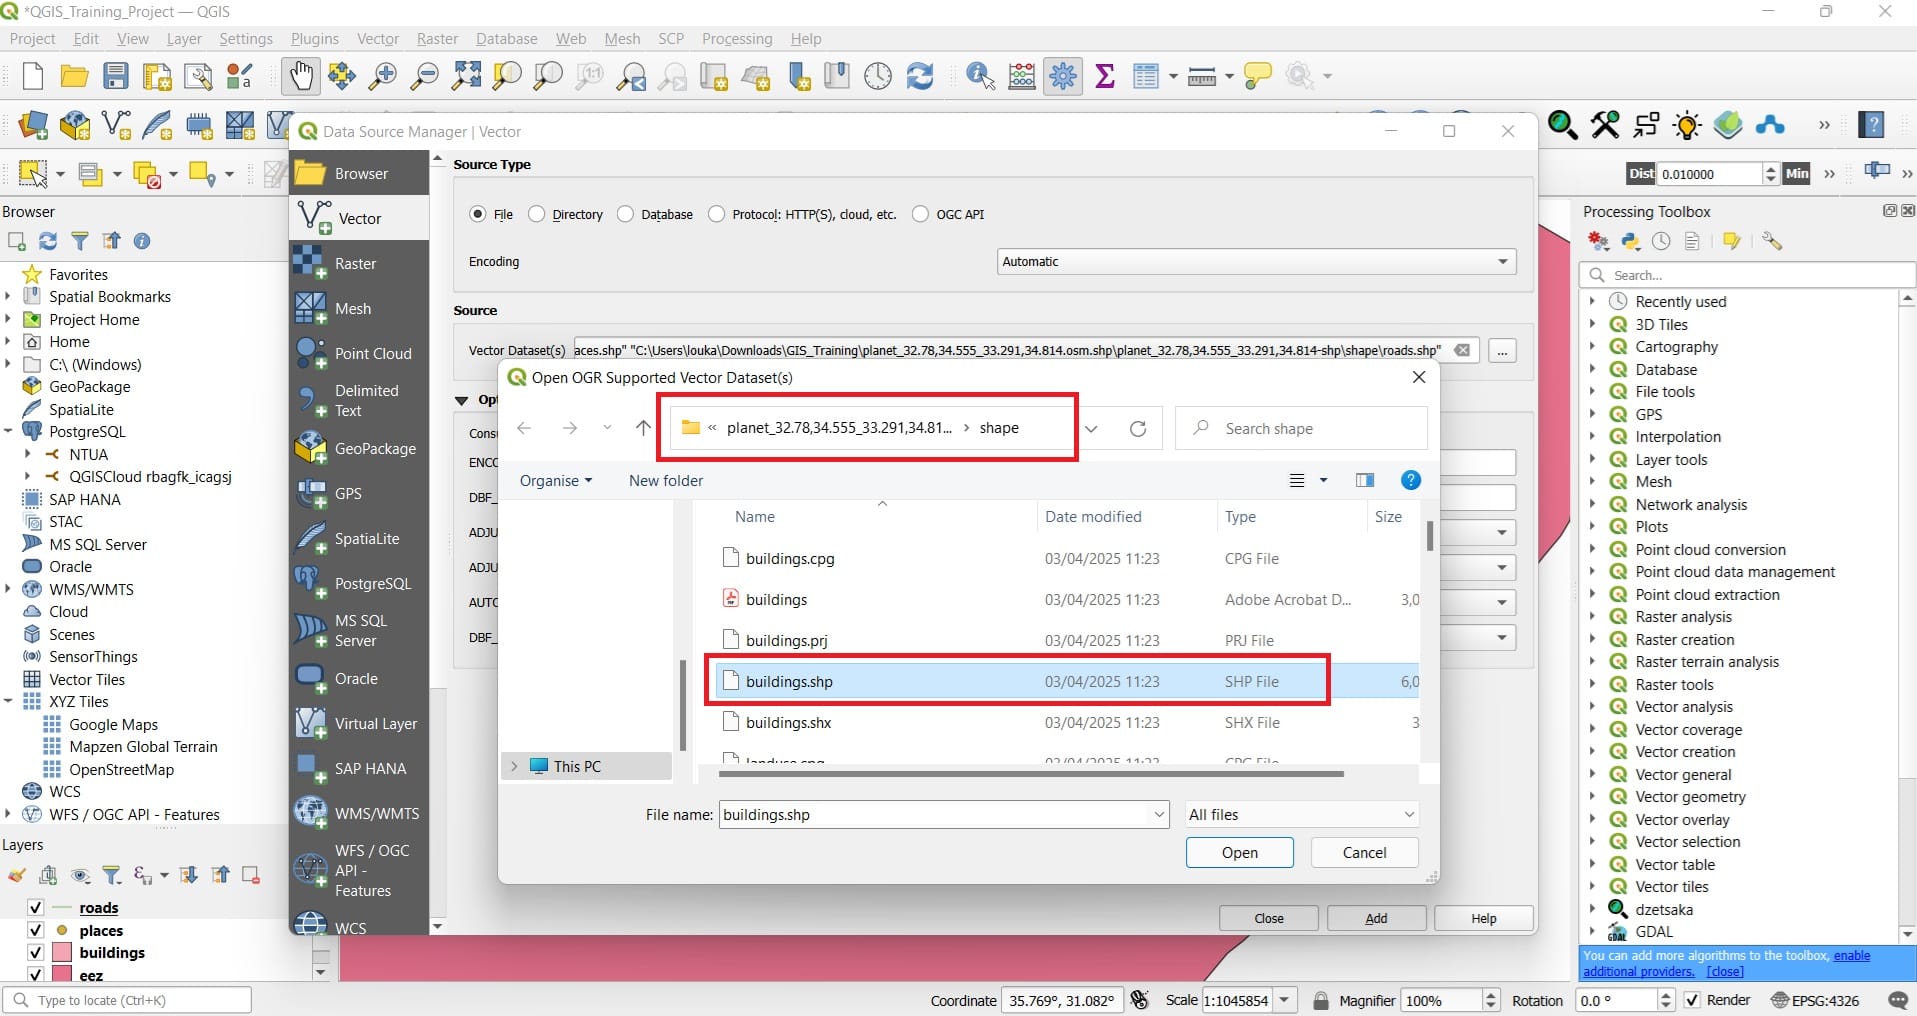
Inside the OSM shapefile (‘planet_37_28……….’ > shape), you may load the ‘buildings’, ‘roads’ and ‘points’ shapefiles (only the .shp file!!!!)
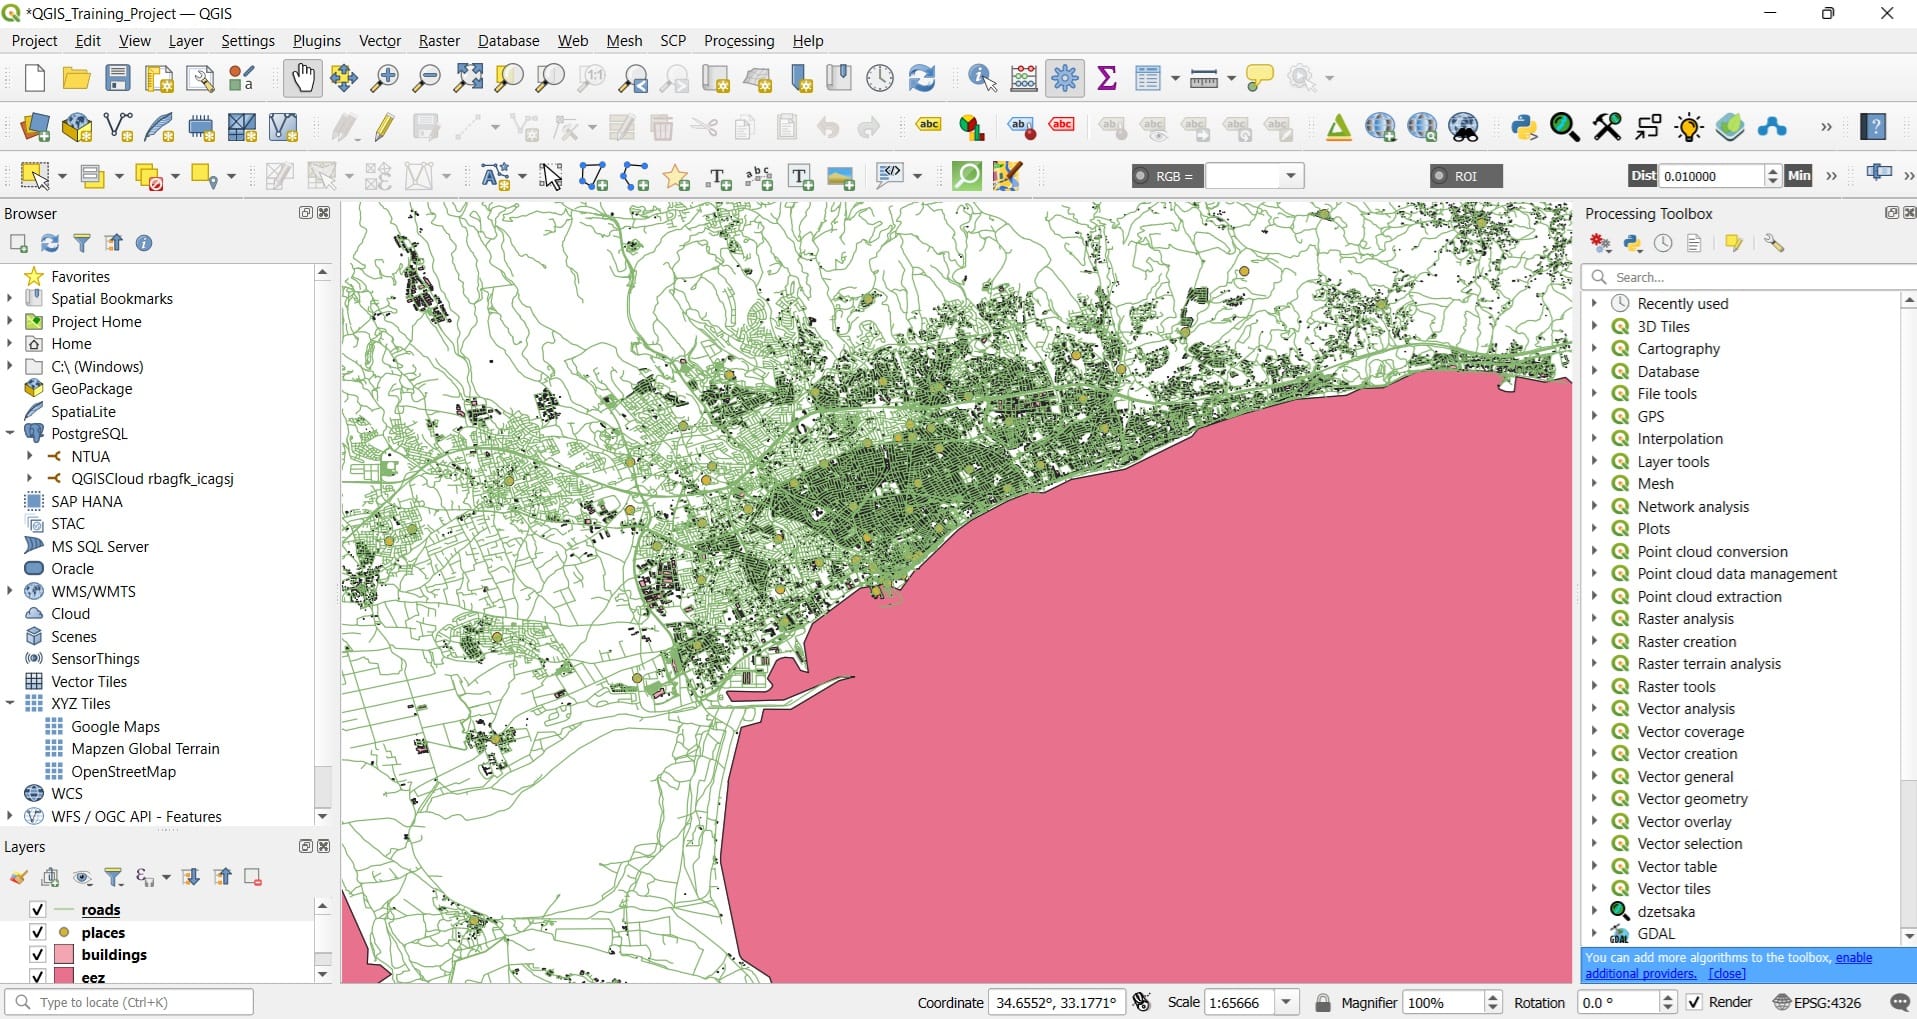
That was it! We loaded our first geospatial data, as you will see in the picture below.
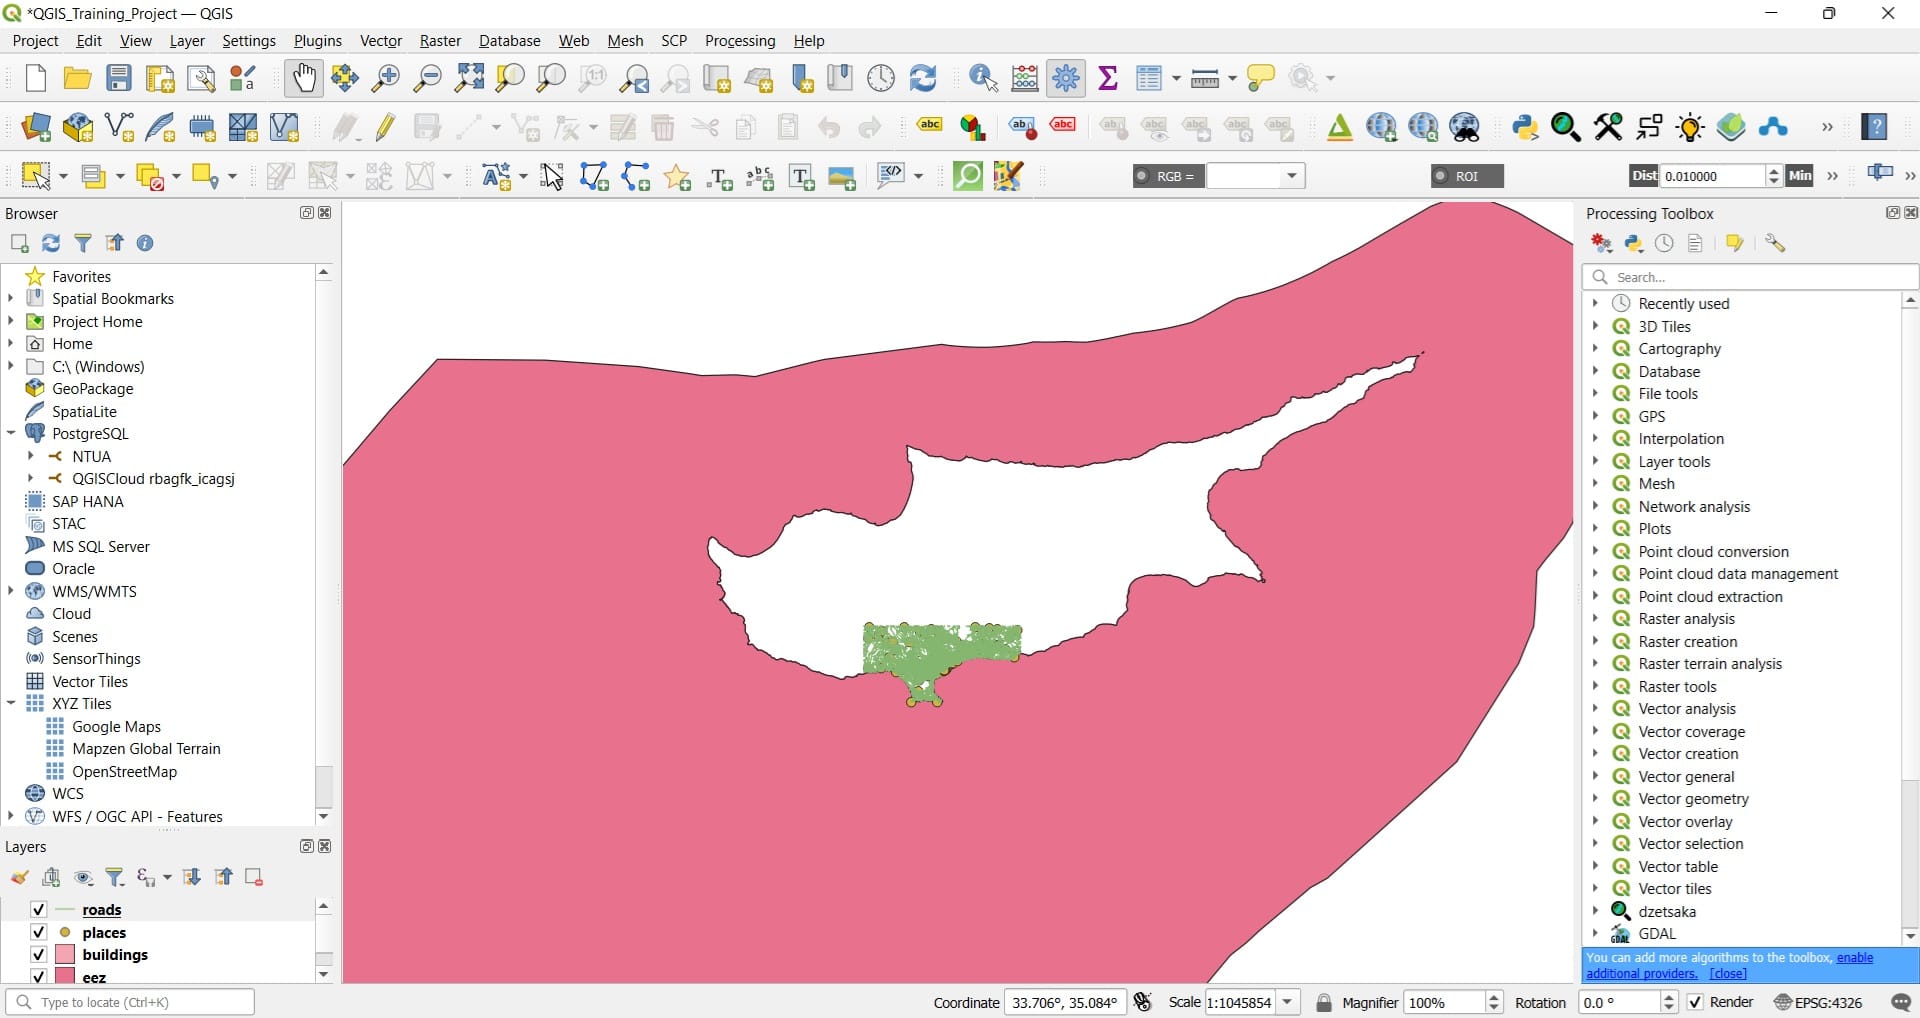
You can try to zoom-in in Limassol area (green area) and you will see how detailed the road network, the buildings and the points of interest are!
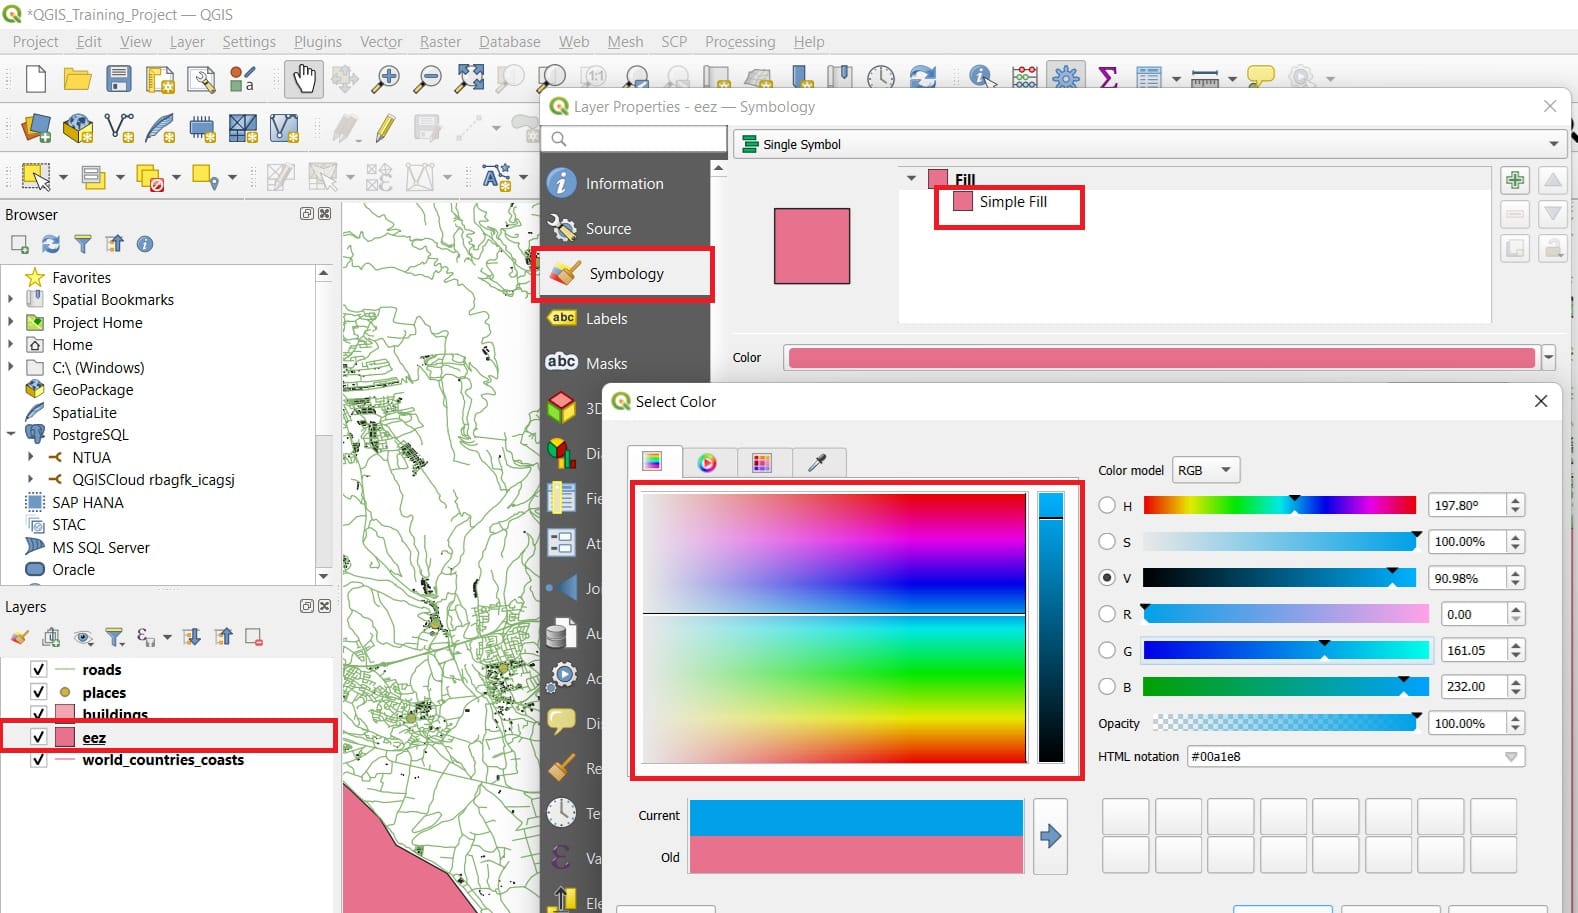
You may also change the colours of your layers, for exampele, the ‘eez’ colour. You can turn it into blue to look more realistic (marine areas). All you have to do is to double click on the ‘eez’ shapefile in the Layers window > Symbology > Fill color > ‘Pick a colour from the color palette’ > Press Ok and Apply
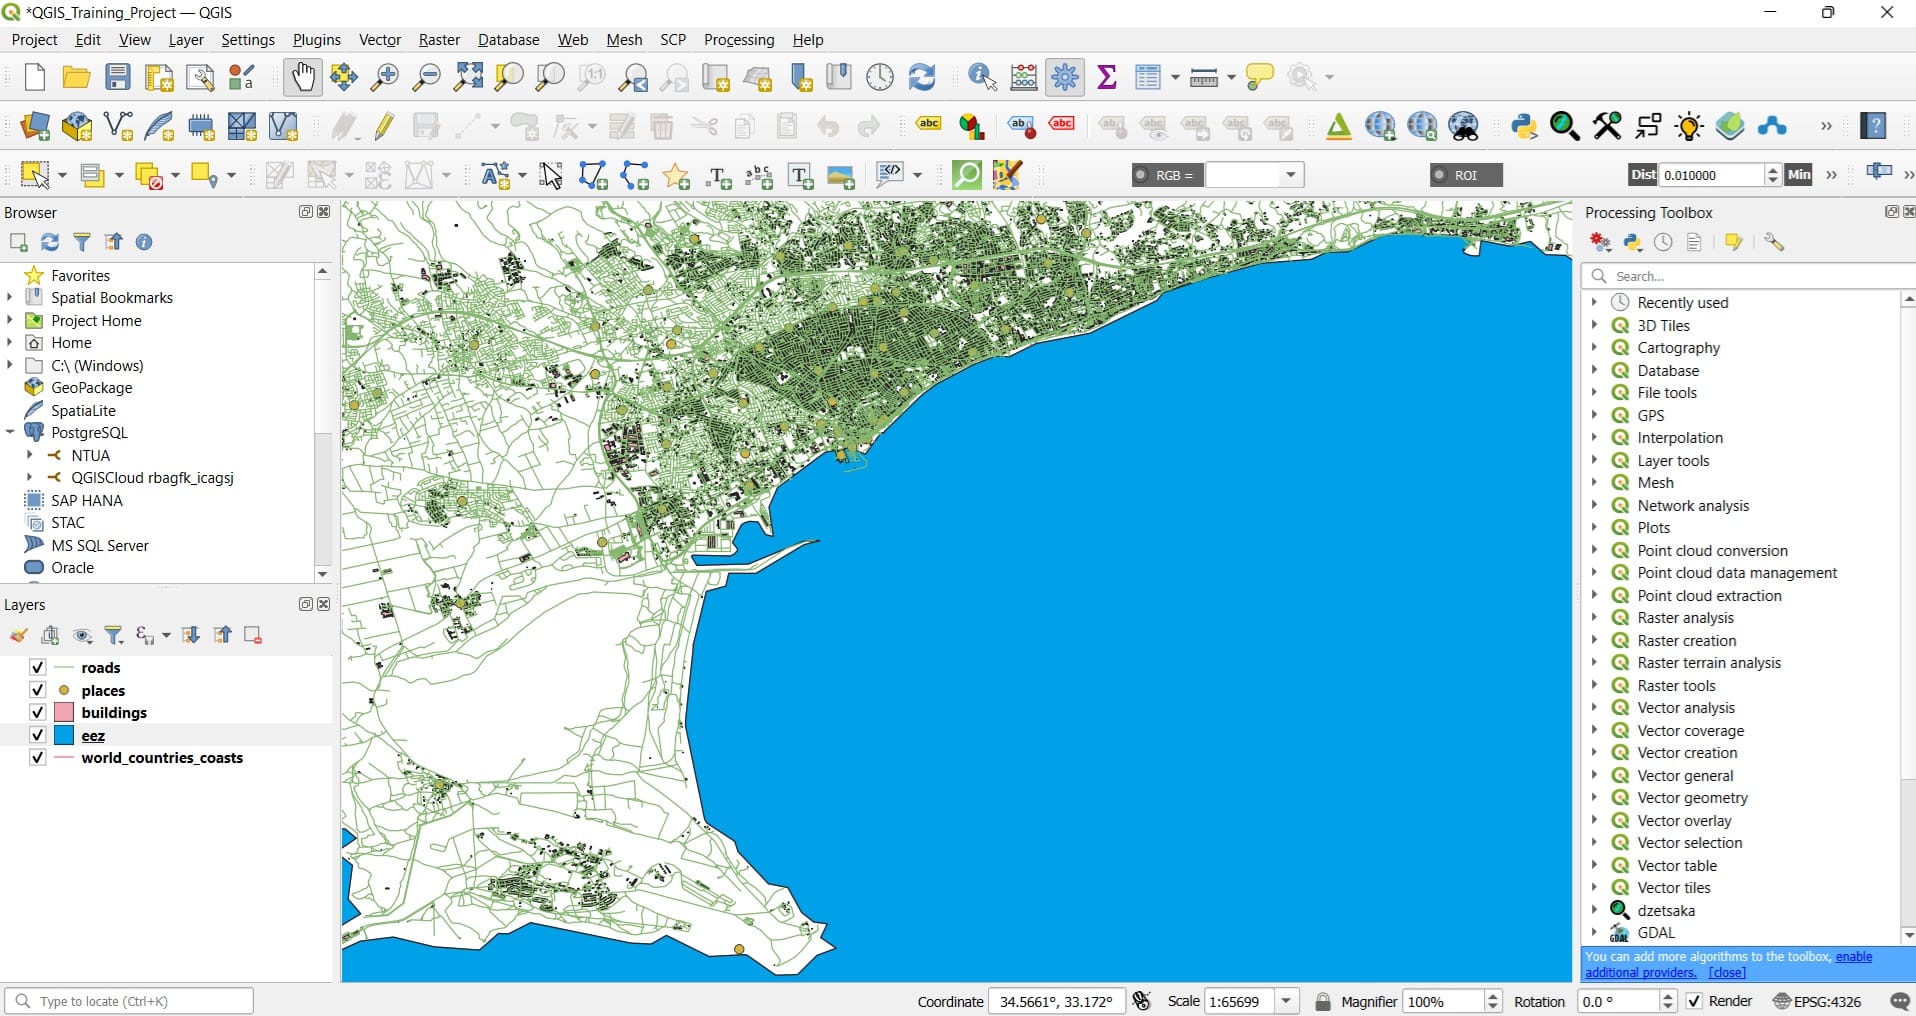
The result will look like this…
In the following videos, you may see in detail how we load vector data and change the symbology (i.e. points, lines or polygons fill and outline colors).
That was it! Let’s now move to the next lesson where we will find out how to download raster data and load them in QGIS Platform!
Keep in mind that raster data may represent the elevation, the bathymetry of an area, different environmental variables (i.e. air quality, temperature), landcover and settlements etc.
Useful links
- Marine regions: Shapefile data (i.e. shorelines or Exclusive Economic Zones)
- European Environmental Agency: GIS Data for all countries
- GeoBoundaries: Shapefile data (administrative units) for all countries
- BBike: Open Street Map (OSM) data worldwide (i.e. road network, buildings, points of interest)