Atmospheric window
The following video gives us an impression of the fact that we cannot see all the radiation in our environment with our eyes. Thermal radiation (infrared radiation) cannot be recognised by the human eye – but with the help of special detectors on the satellites, this radiation can also be made visible.
However, there is something else to consider here: the “atmospheric window”.
Satellites are located outside our atmosphere and therefore the radiation must first penetrate the atmosphere. Not all radiation is able to do this. For example, most of the very high-energy ultraviolet radiation that reaches the earth from the sun is blocked by the atmosphere. This protection from high-energy radiation is important for human life on earth.
However, shortwave infrared radiation (shortwave IR) passes relatively well through the atmosphere. This helps us to detect intact vegetation from space, as healthy plants reflect a relatively large proportion of the sun’s IR radiation and can therefore be detected by satellite images.
However, we must bear in mind that not all radiation can penetrate the atmospheric window. A very good description of the atmospheric window can be found on the following website:
https://gisgeography.com/atmospheric-window/
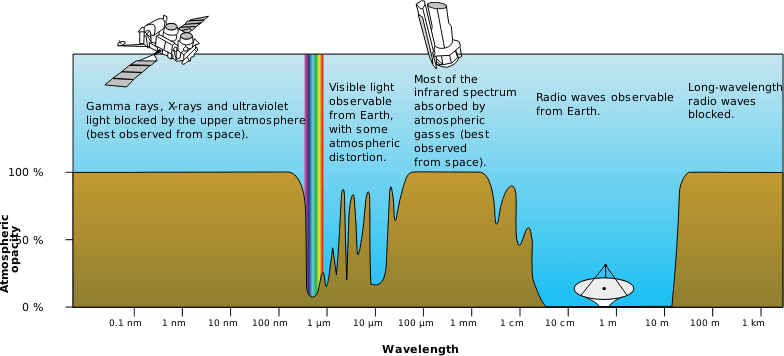
Reference for the above image: https://gisgeography.com/atmospheric-window/
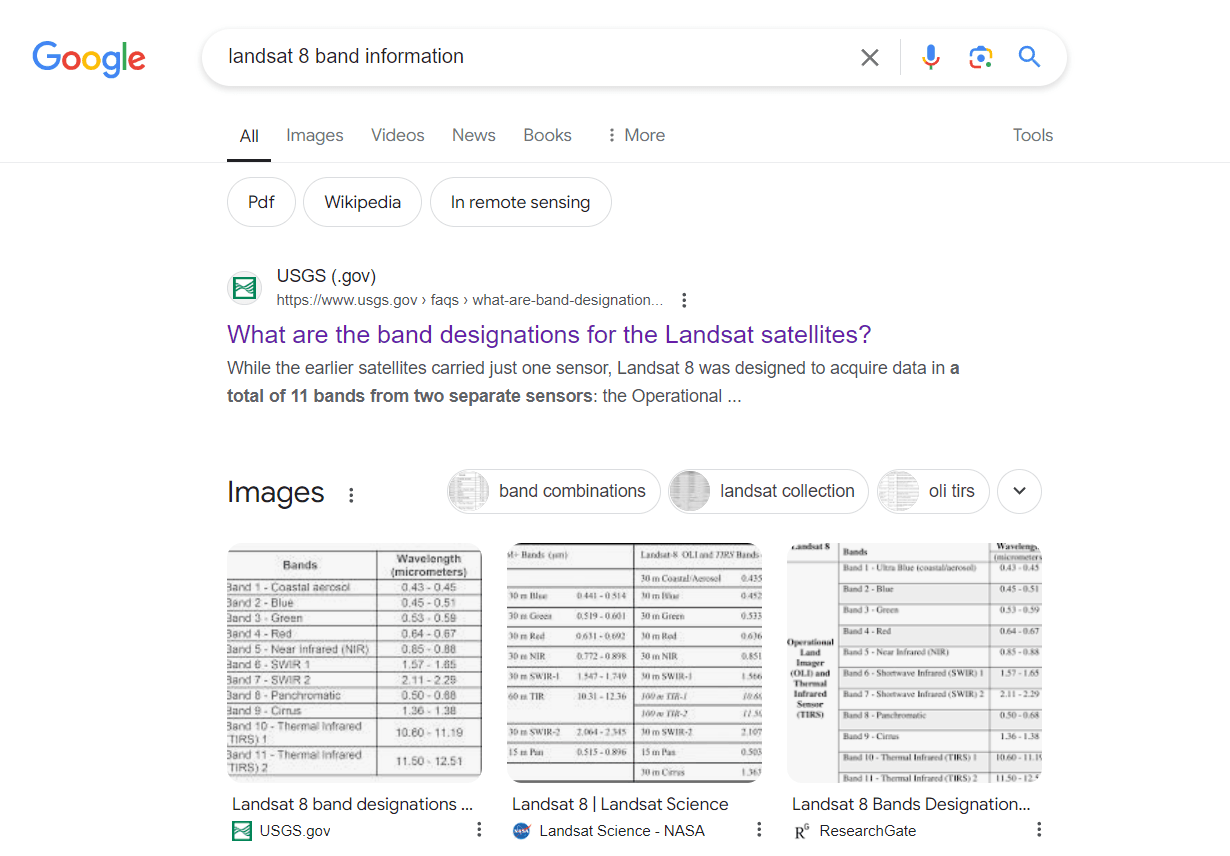
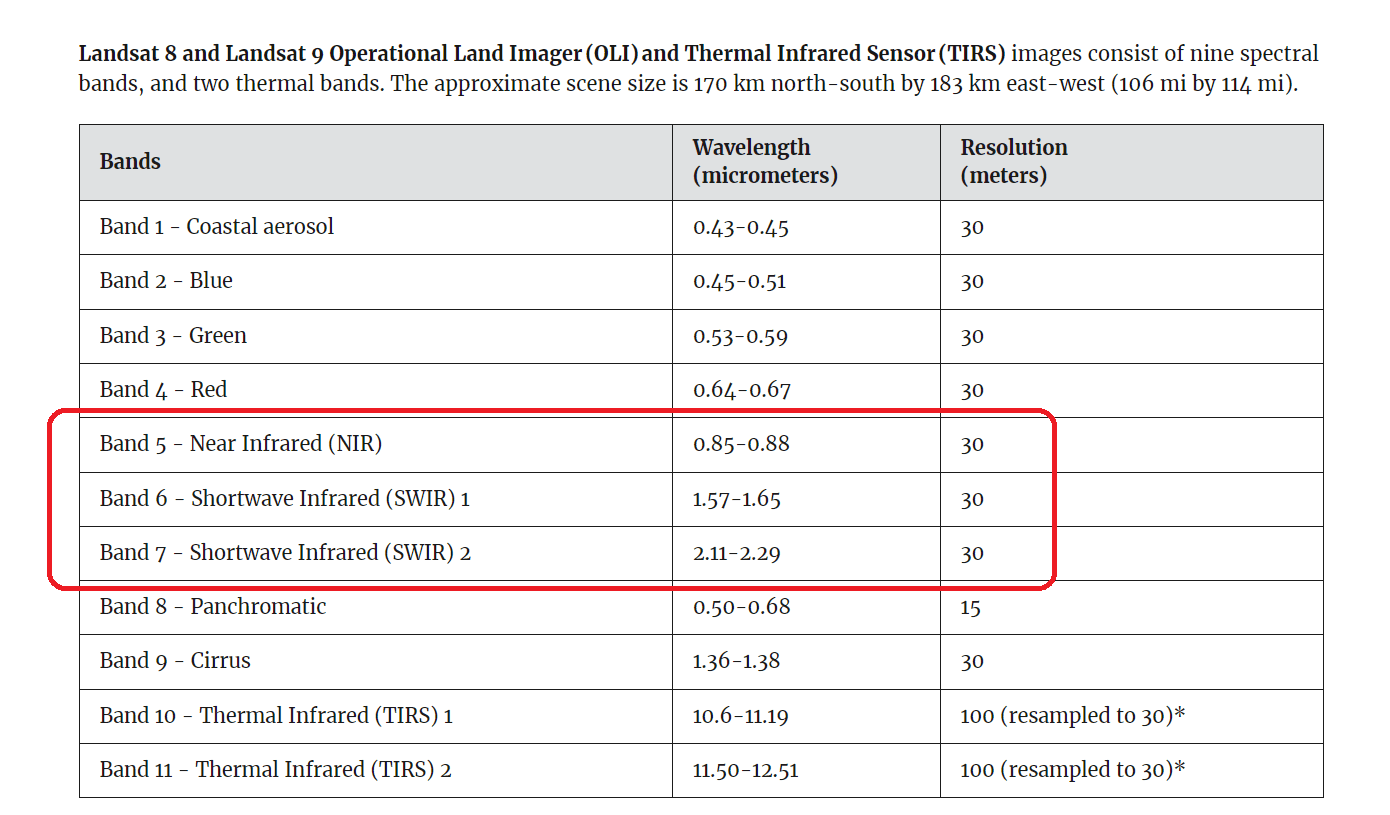
Different satellites are equipped with a wide variety of sensors. Details can be found on the Internet (e.g. by searching: “Landsat 8 Band information”).
As you can see from the results for the Landsat 8 satellite, the relevant wavelengths are in the range between 0.8 micrometres and 2.3 micrometres.
This also provides a good opportunity to talk about the prefix “micro” with the students. Our students should be familiar with some of the basics:
To put this into perspective:
- 100 micrometers (0.1 mm): Smallest detail resolvable by the human eye (about the size of a human hair).
- 10 micrometers: Size of a typical human cell.
- 1 micrometer: Size of bacteria.
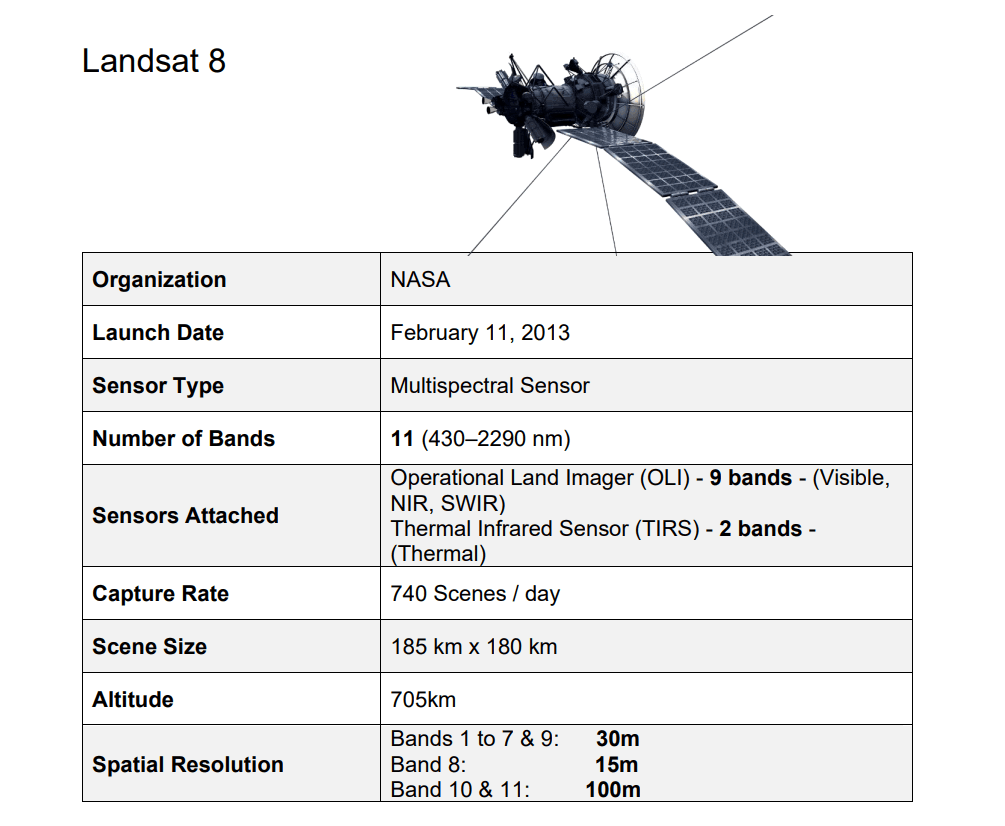
It would also be desirable if our students could relate data to each other in a meaningful way. Initially, students certainly need to be supported well in this task. An elaborated example (also called a “worked-out example” in a pedagogical context) can be used to support this “scaffolding” process. In the following, our students find a list of essential data – such as spatial resolution – from the Landsat 8 satellite. The students’ task is now to research a comparable data sheet for another satellite (such as Sentinel 2, MODIS, VIIRS) and to be able to talk about the interpretation of the individual facts (such as time resolution).
What does it mean when you say Landsat 8 has a time resolution of 16 days, while Sentinel 2 has a time resolution of 5 days?
And to put everything in the right perspective:
Is it possible to draw the earth as a circle on an A4 sheet AND indicate the distance of the satellite above the ground to scale in the same drawing?
And what if you wanted to include our natural satellite – the moon – in the same drawing?