Some reflexions on reflectance | RS-EO-SatApp-1.3.2
Reflectance is about which part of a diverse group is sent back. In our case, the group is the entire electromagnetic spectrum, or in other words: every wavelength that our sun throws at the earth.
Our sun not only casts visible light onto the earth – it also emits some UV (ultraviolet) and IR (infrared) radiation towards us. A large proportion of the UV radiation is blocked by the earth’s atmosphere. This part of the sun’s electromagnetic radiation cannot pass through the “atmospheric window”.
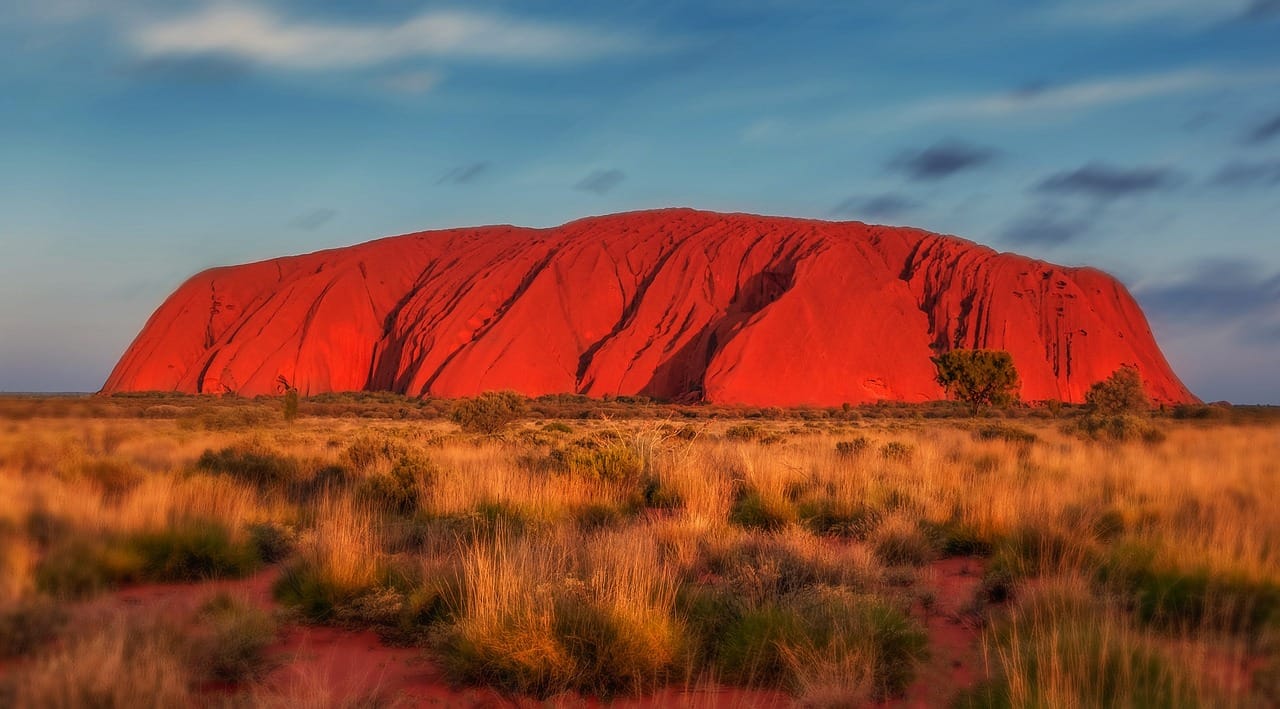
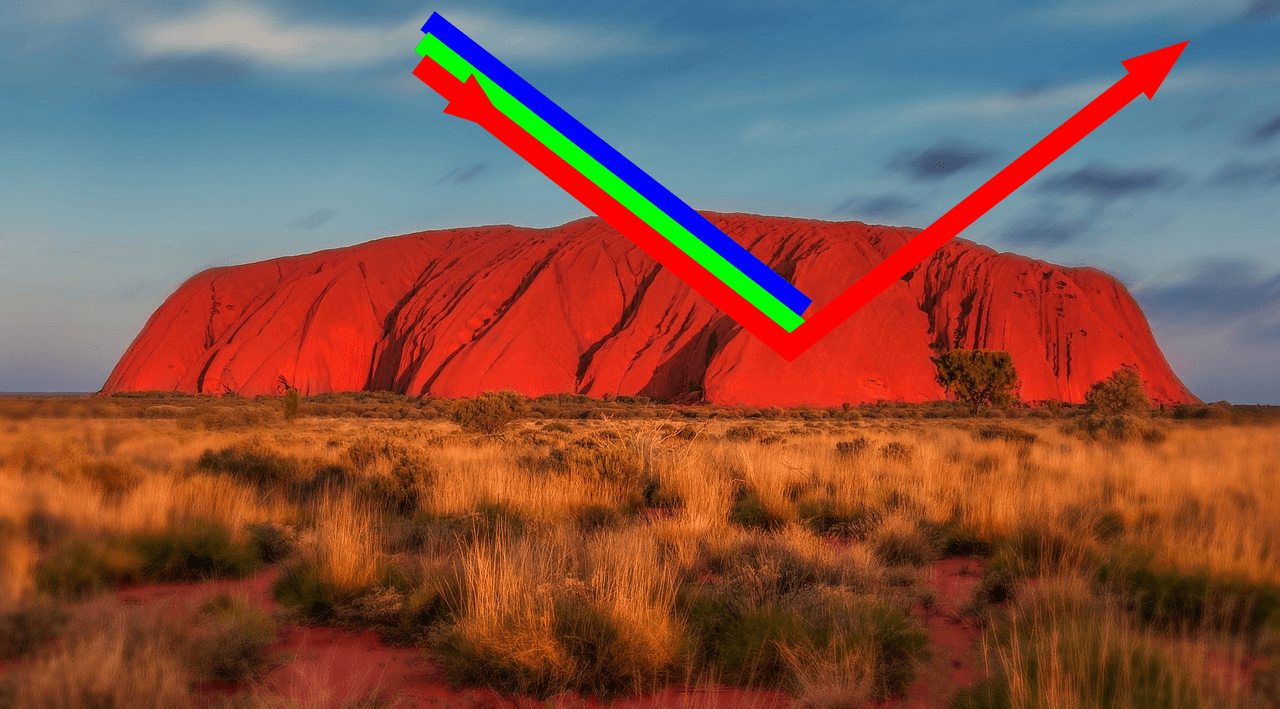
But not everything comes back to the sender. When the sunlight shines on the red rocks of Ayers Rock in Australia, the red part of the electromagnetic radiation is obviously sent back – otherwise it would not look so red in our eyes, as any observer of the marvellous scene can confirm. The reddish colour of the rock comes from the iron oxide in the sandstone.
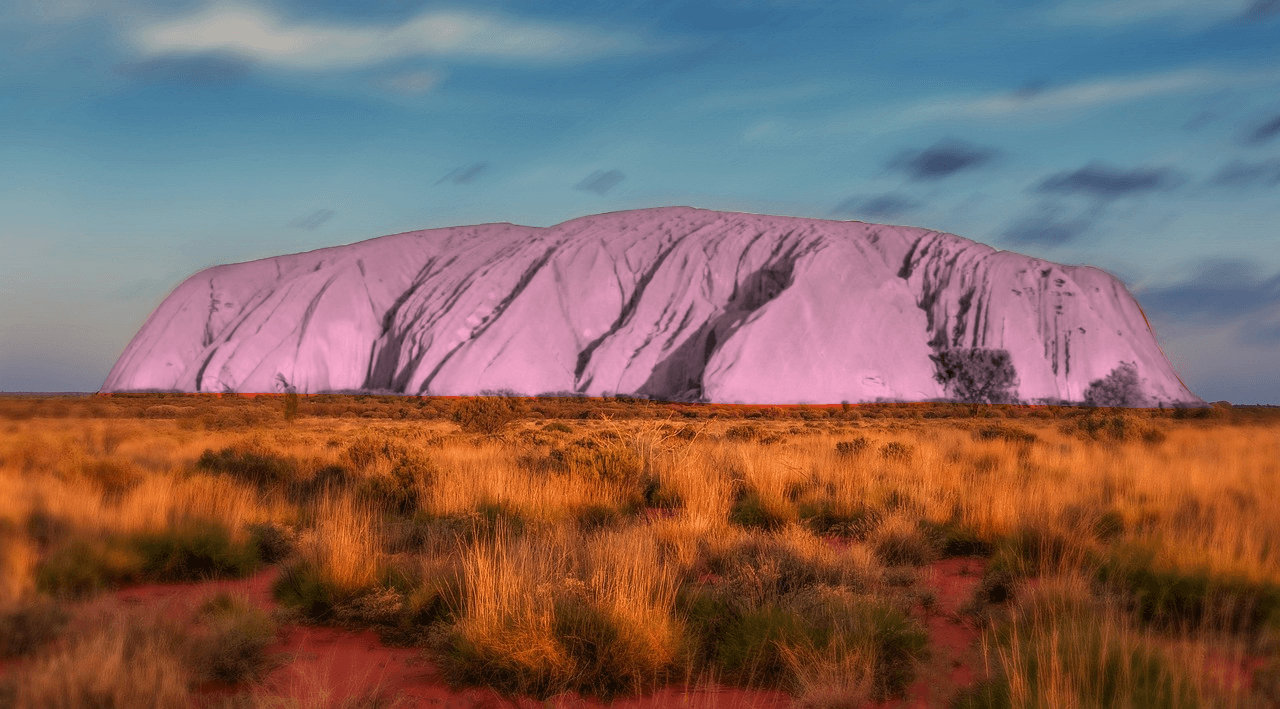
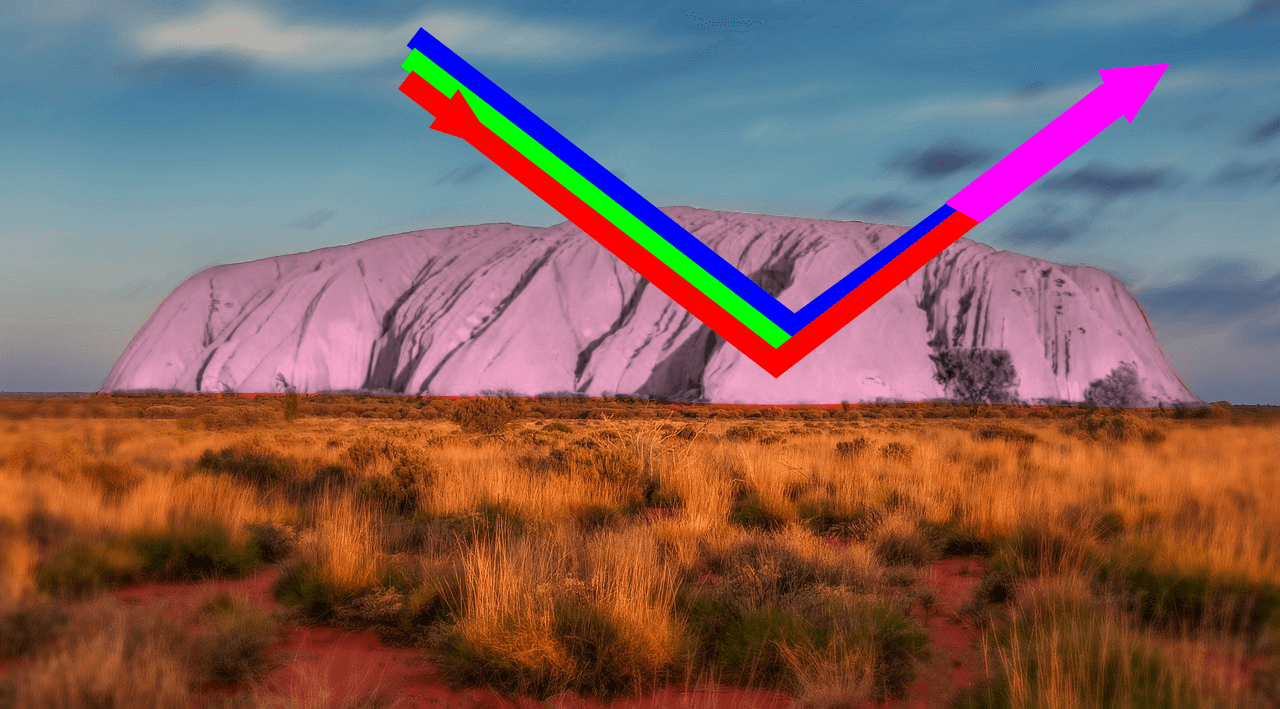
On the other hand, the bluish component in the electromagnetic radiation is obviously not reflected back to the same extent – otherwise the mountains would give the observer the impression of a mixture of red and blue (i.e. magenta) – it would look something like this:
We could depict this situation in an infographic like this:
However, the following picture does not reflect reality – obviously!
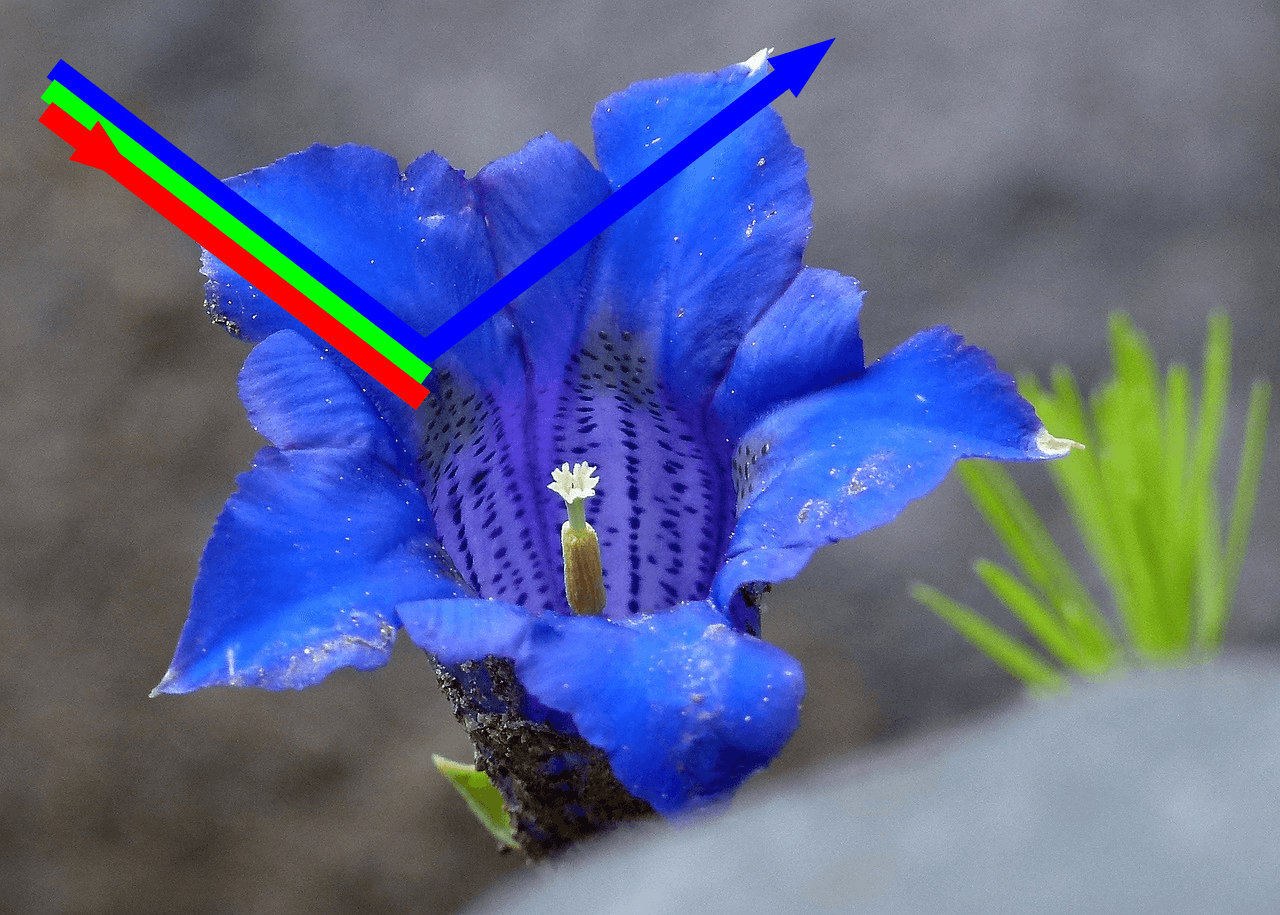
Different objects reflect different parts of the electromagnetic spectrum. Some plants, such as the blue alpine gentian, reflect blue – which is why it looks blue.
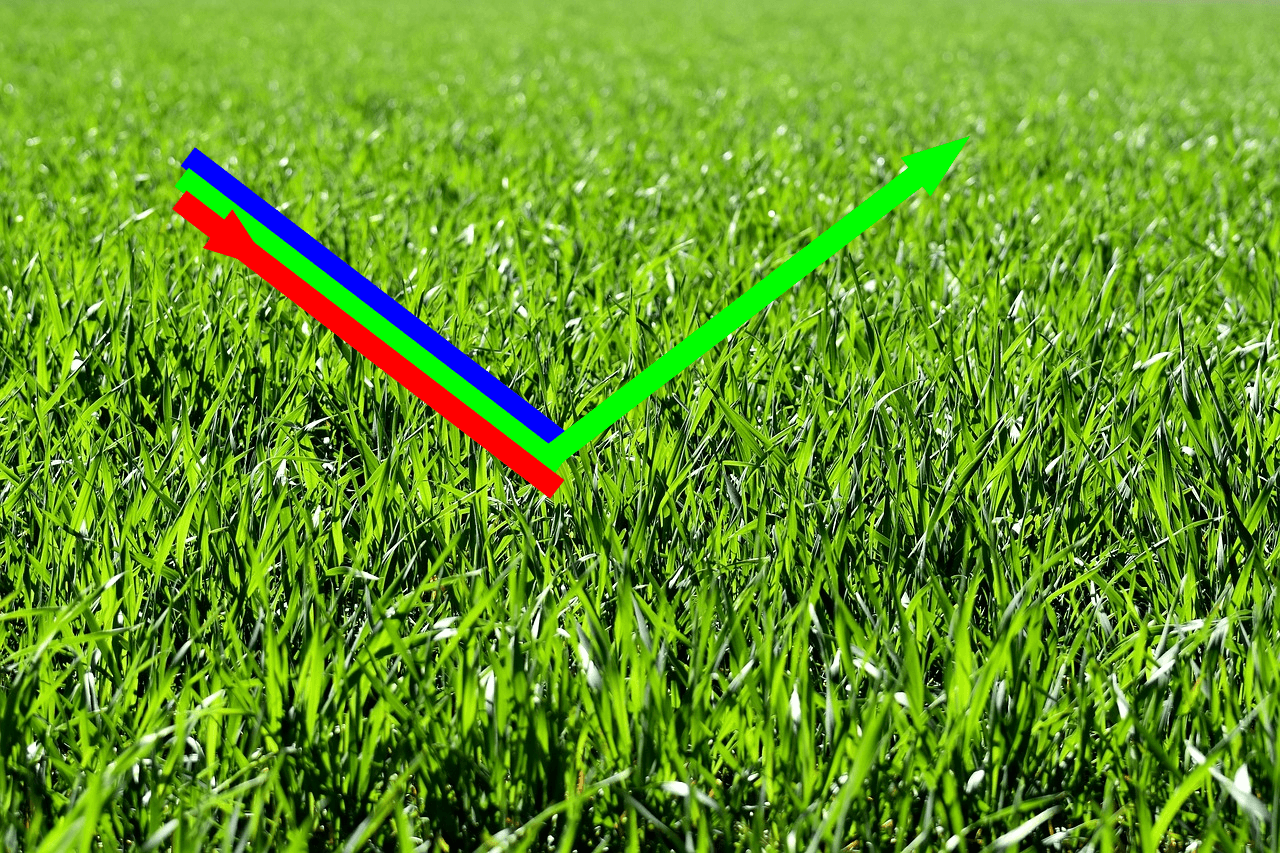
A lawn mainly reflects green – hence it looks greenish.
And if an object reflects part of the infrared radiation, our eyes cannot detect this type of radiation – but the satellite sensors can.
Some important measurement parameters in agriculture use the reflectivity of infrared radiation – such as the Normalised Difference Vegetation Index, or NDVI for short.
The Normalized Difference Vegetation Index (NDVI) quantifies vegetation by measuring the difference between near-infrared (which vegetation strongly reflects) and red light (which vegetation absorbs). Satellites can collect this information on reflected radiation and the NDVI can then be calculated to check whether there are any major problems with the vegetation in the area.
With the EO Browser, we can combine the information collected from the satellites even further and adjust the visualisation of the different spectral bands to obtain meaningful images. Here are some examples:
- True colour – portrays the impression we have as human beings
- False colour – to help with the interpretation of images
- Moisture Index – Visual interpretation of moisture
- NDVI – Vegetation Index
- SWIR – Shortwave-infrared composite
- NDWI – Normalized Difference Water Index
- NDSI – Normalized Difference Snow Index
and much more …