Experiment: Building and Using an Air Quality Monitoring Station
To test the hypothesis, they can create their own air quality station so they can monitor and record CO2 levels throughout the day wherever they wish.
Data should be collected under different conditions — during school hours, rush hours, and quieter times — to see how activity affects air quality. It’s best to measure over several days or a full week, in both dry and wet weather, to get reliable and varied results. Ambient conditions (such as weather, wind direction, and temperature) or any other relevant observations (such as nearby traffic, construction, etc) should be described qualitatively in a field notebook at the same time as the measurements to help identify possible correlations.
Creating a School Air Quality Monitoring Station.
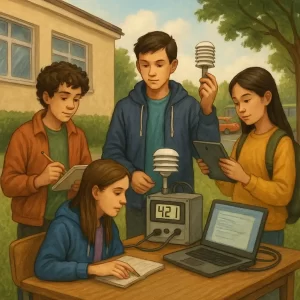
Illustration of students assembling and using an air quality monitoring setup to collect CO2 levels
throughout the day under different environmental conditions. The scene highlights data collection,
systematic observation, and the scientific process of testing hypotheses about air quality.
Credits: Custom educational illustration created for the course
Air Quality Exploration: Understanding the Invisible World We Breathe, generated by an AI model..
Additionally, for comparison, they can also collect data on traffic volume and greenhouse gas emissions, or contact local transportation departments to request vehicle count records at different times of the day and in different places. They can also use online traffic monitoring tools such as Google Maps or Waze, which offer real-time data. To estimate emissions, students can apply standard emission factors for different types of vehicles or use online calculators for the carbon footprint associated with using vehicles with different fuel consumption. They can also consult local studies that have already measured emissions in the area and compare them with the results obtained.
The entire research process, including the description of the problem, the research questions, the hypothesis, methods used to test them and analyse collected data should be documented. This will help students revise their hypothesis when necessary and draw conclusions from what they found.