🌱 Introduction to the Lesson
In this lesson, we shift from screen to classroom, transforming the GIS-based activities you saw in QGIS into an engaging, hands-on experience tailored for upper primary school students. Through this project-based learning activity, students will take on the role of planners working together to decide the best locations for installing offshore wind turbines. In particular, you and your students will:
✅ Explore the basics of renewable energy, with a focus on offshore wind farms
✅ Learn how to read and combine printed thematic maps
✅ Practice decision-making and teamwork through hands-on spatial planning
✅ Understand how to balance environmental and technical factors
✅ Design your own nature-inclusive offshore wind farm within a budget
Using printed maps that display real-world data, such as wind speed, marine habitats, water depth, and protected areas, students will explore how various environmental and technical criteria influence siting decisions. They will overlay and analyze these layers, just like we did digitally, to find suitable locations for their wind farms.
Then comes the fun part: using a fixed budget, students will collaboratively build their own offshore wind farm, making thoughtful choices about where and how to place turbines, while respecting nature and sustainability goals.
This lesson fosters critical thinking, environmental awareness, spatial reasoning, and team collaboration, giving students a hands-on introduction to how real-world decisions about renewable energy are made.
Let’s empower the next generation of sustainable thinkers—map in hand and creativity in motion! 🌍🗺️💡🌬️
🧑🏫 Teacher Instructions – Step-by-Step
The activity has been developed for upper primary or lower secondary school students (age 12 – 13), it’s duration is 6 hours and is divided in 4 steps including:
- Introducing the problem and providing background information
- Identifying optimal areas using printed maps
- Building the offshore wind farm and estimating the costs
- Evaluating students results and the optimal areas they selected
Let’s break down these steps!
Step 1: Introduce key concepts – Background information (45 minutes)
Begin by discussing with students the basics of Offshore Wind Farm planning, including types of wind turbines, foundations, energy generation capacities, and environmental limitations. You may also explain why we need to harvest wind energy and why Offshore Wind Farms have been developed since 1991, mainly in the Baltic and Noth Seas. The following videos will help you build your story…
And the key criteria we consider to find optimal areas…
What are the advantages and disadvantages of offshore wind farms?
According to the American Geoscience Institute [1], the advantages and disadvantages of Offshore Wind Energy are:
Advantages:
- Offshore wind speeds tend to be faster than on land. Small increases in wind speed yield large increases in energy production: a turbine in a 8 meters/second wind can generate twice as much energy as a turbine in a 6 meters/second wind. Faster wind speeds offshore mean much more energy can be generated.
- Offshore wind speeds tend to be steadier than on land. A steadier supply of wind means a more reliable source of energy.
- Many coastal areas have very high energy needs, especially in different European countries. Building offshore wind farms in these areas can help to meet those energy needs from nearby sources.
- Offshore wind farms have many of the same advantages as land-based wind farms since they provide renewable energy; they do not consume water; they provide a domestic energy source; they create jobs; and they do not emit environmental pollutants or greenhouse gases.
Disadvantages:
- Offshore wind farms can be expensive and difficult to build and maintain. In particular:
- It is very hard to build robust and secure wind farms in water deeper than around ~70 m, or over half a football field’s length. However, floating wind turbines are beginning to overcome this challenge.
- Wave action, and even very high winds, particularly during heavy storms or hurricanes, can damage wind turbines.
- The production and installation of power cables under the seafloor to transmit electricity back to land can be very expensive.
- Effects of offshore wind farms on marine habitats, marine mammals and birds are not fully understood (!!!!).
- Offshore wind farms built within view of the coastline (up to 40 km offshore, depending on viewing conditions) may be unpopular among local residents, and may affect tourism and property values.
As shown in the videos above, the key criteria to identify optial areas include (you may use the maps and .gif images in the .ppt file attached):
The Five Site-Selection Criteria (or any site-selection criteria)
- Mean Wind Speed – Students evaluate wind availability, a key requirement for energy production.
- Bathymetry – Depth affects construction costs and technology types (floating vs fixed turbines).
- Natura Areas – Shows environmental constraints; students must avoid impacting protected ecosystems.
- Distance to Onshore Grid – Cables must connect to the onshore grid; longer distances increase cost and energy loss.
- Distance to Ports – Proximity to ports is important for logistics during installation and maintenance.
The maps below are in Greek and they are focusing on the Aegean Sea in Greece! Feel free to create your own maps either by printing them via the Global Wind Atlas platform (wind speed and bathymetry) and other Web-GIS portal for the Natura areas, the ports and the grid connection points or by creating your own maps using QGIS and the instructions provided in the course ‘Cartography and Spatial Thinking’!
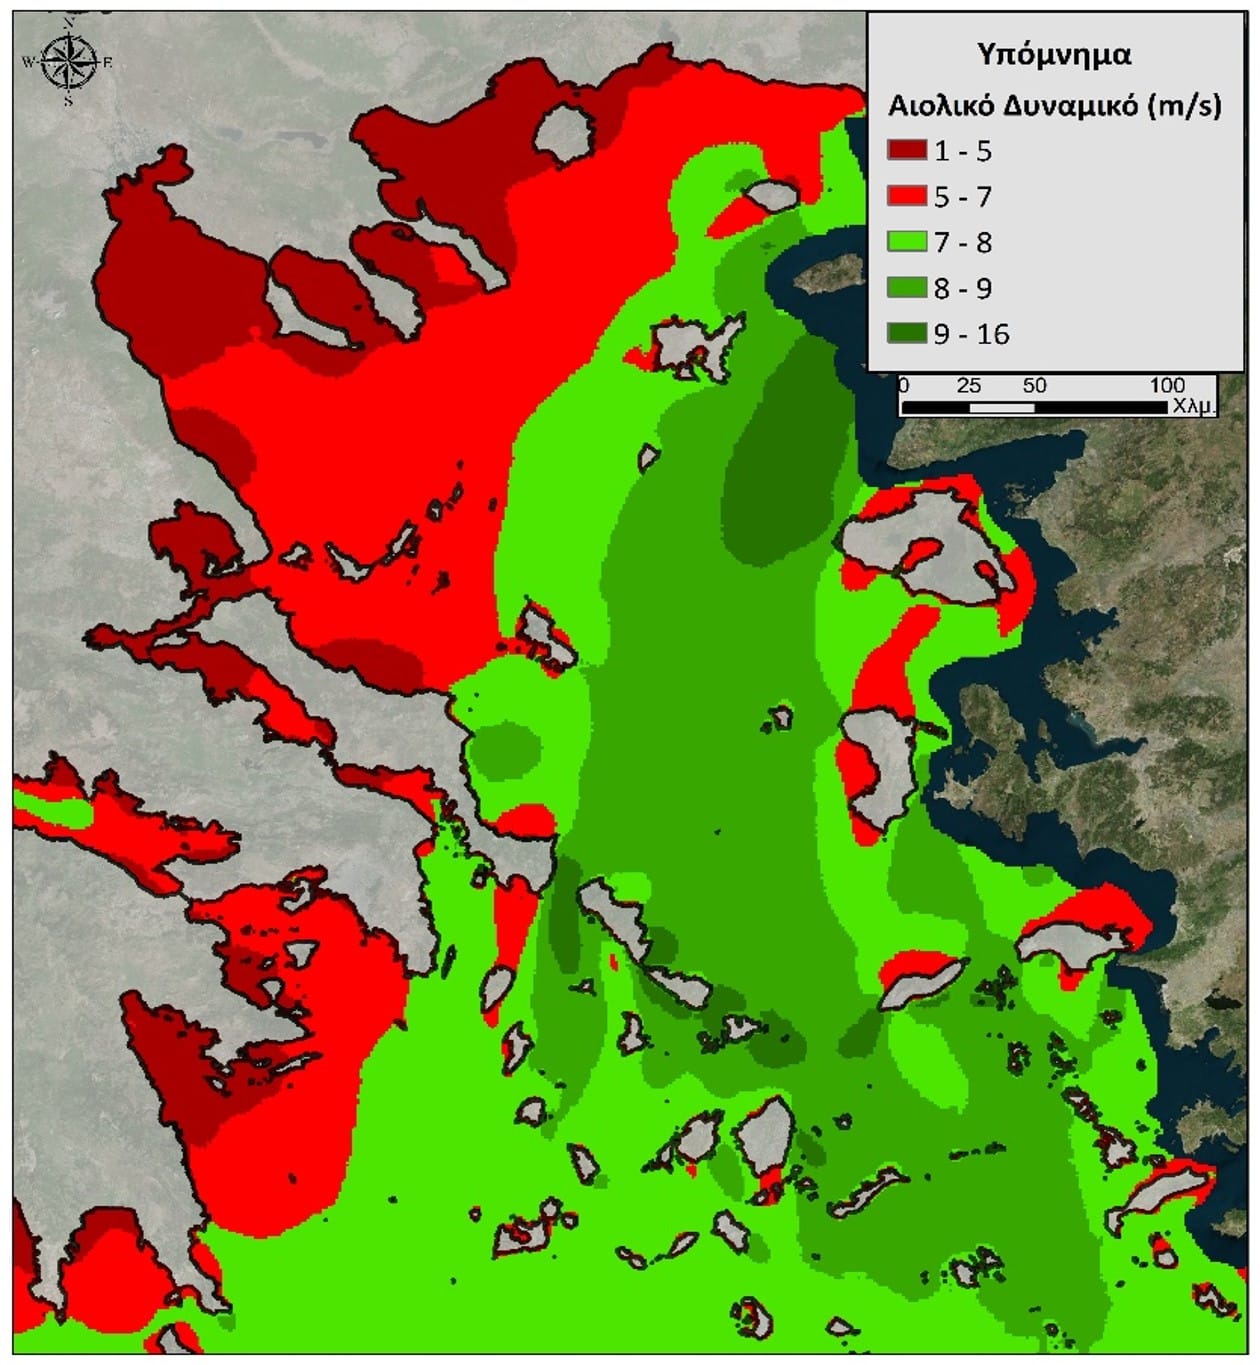
Wind Speed (in meters per second)
We explain to students what the maps show (i.e. the legend and the color differentiations). For the wind speed, green areas indicate high wind speed areas and the red colors low wind-speed areas. Are we allowed to select both green and red areas? Yes, BUT, it’s not a good option to go to the dark red areas (we need a minimum wind speed of 5 m/s) and also, we should be careful on the size of the wind turbine we will select! Big wind turbines go to windy areas and smaller wind turbines to less windy areas.
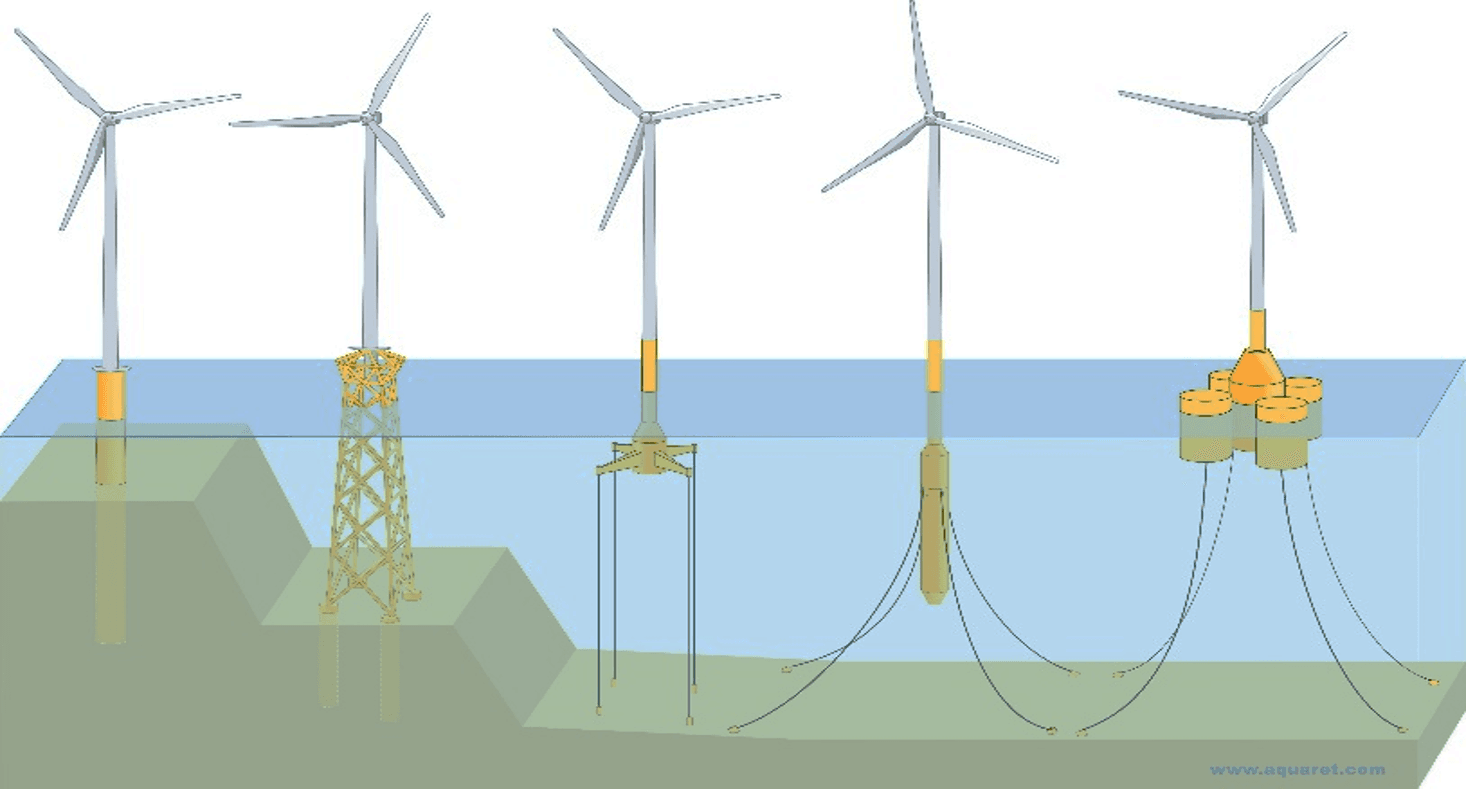
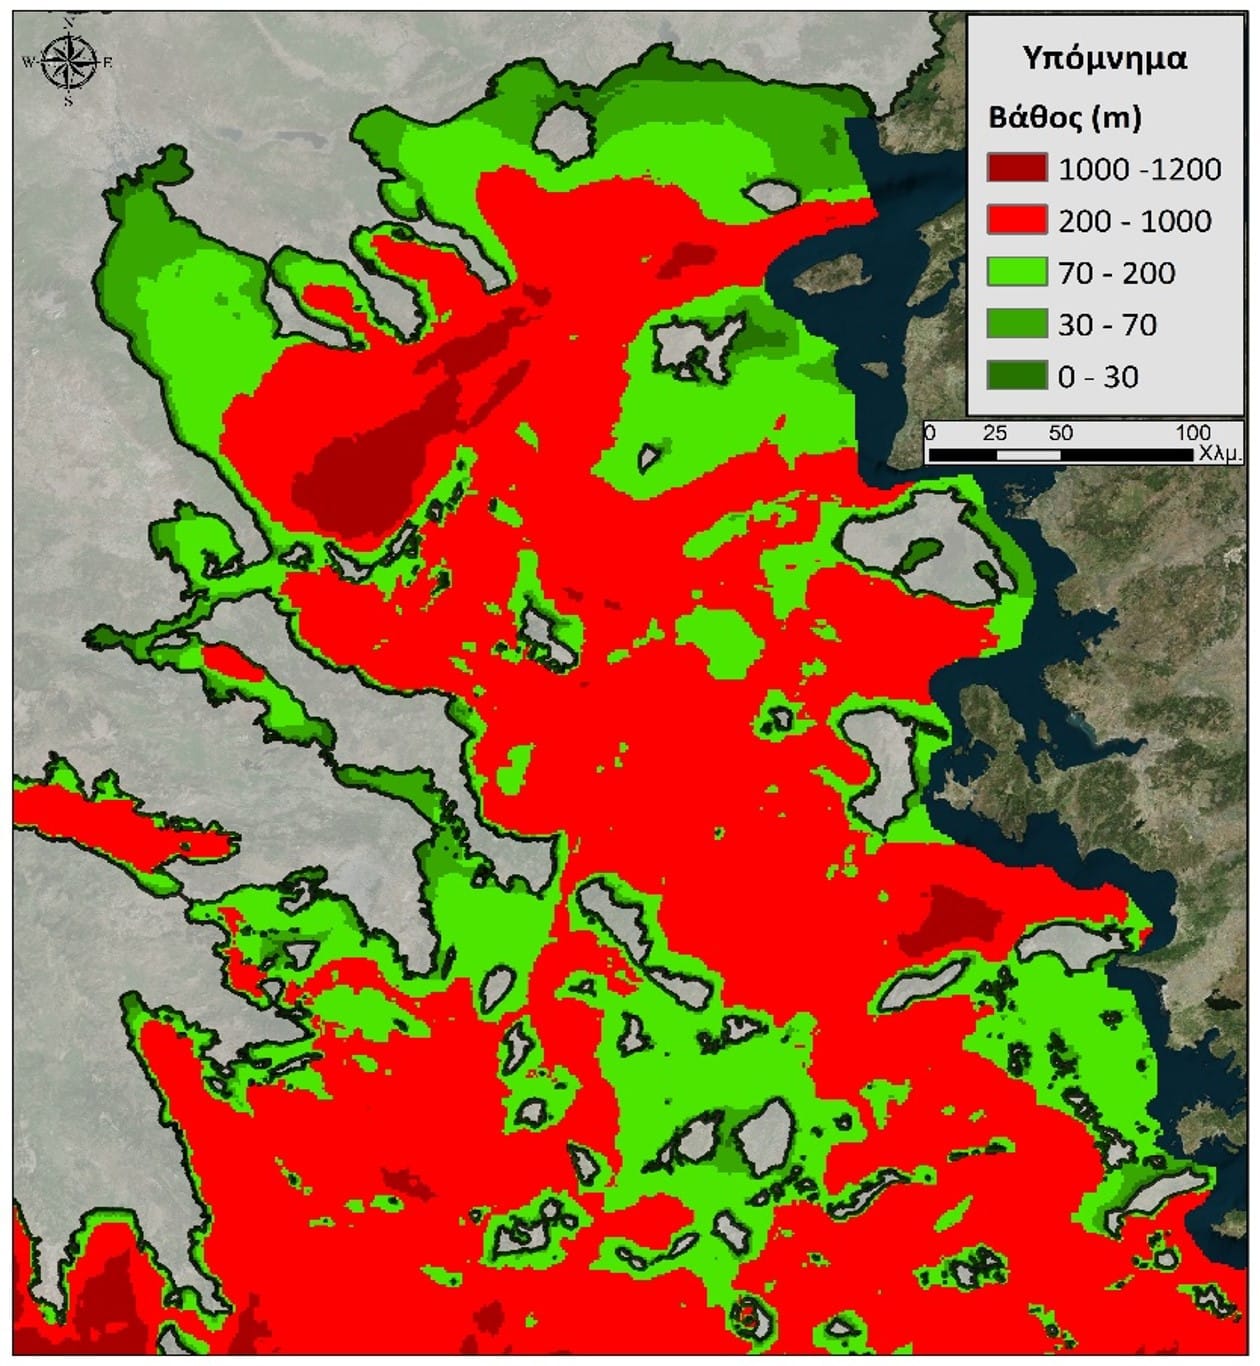
Bathymetry (in meters)
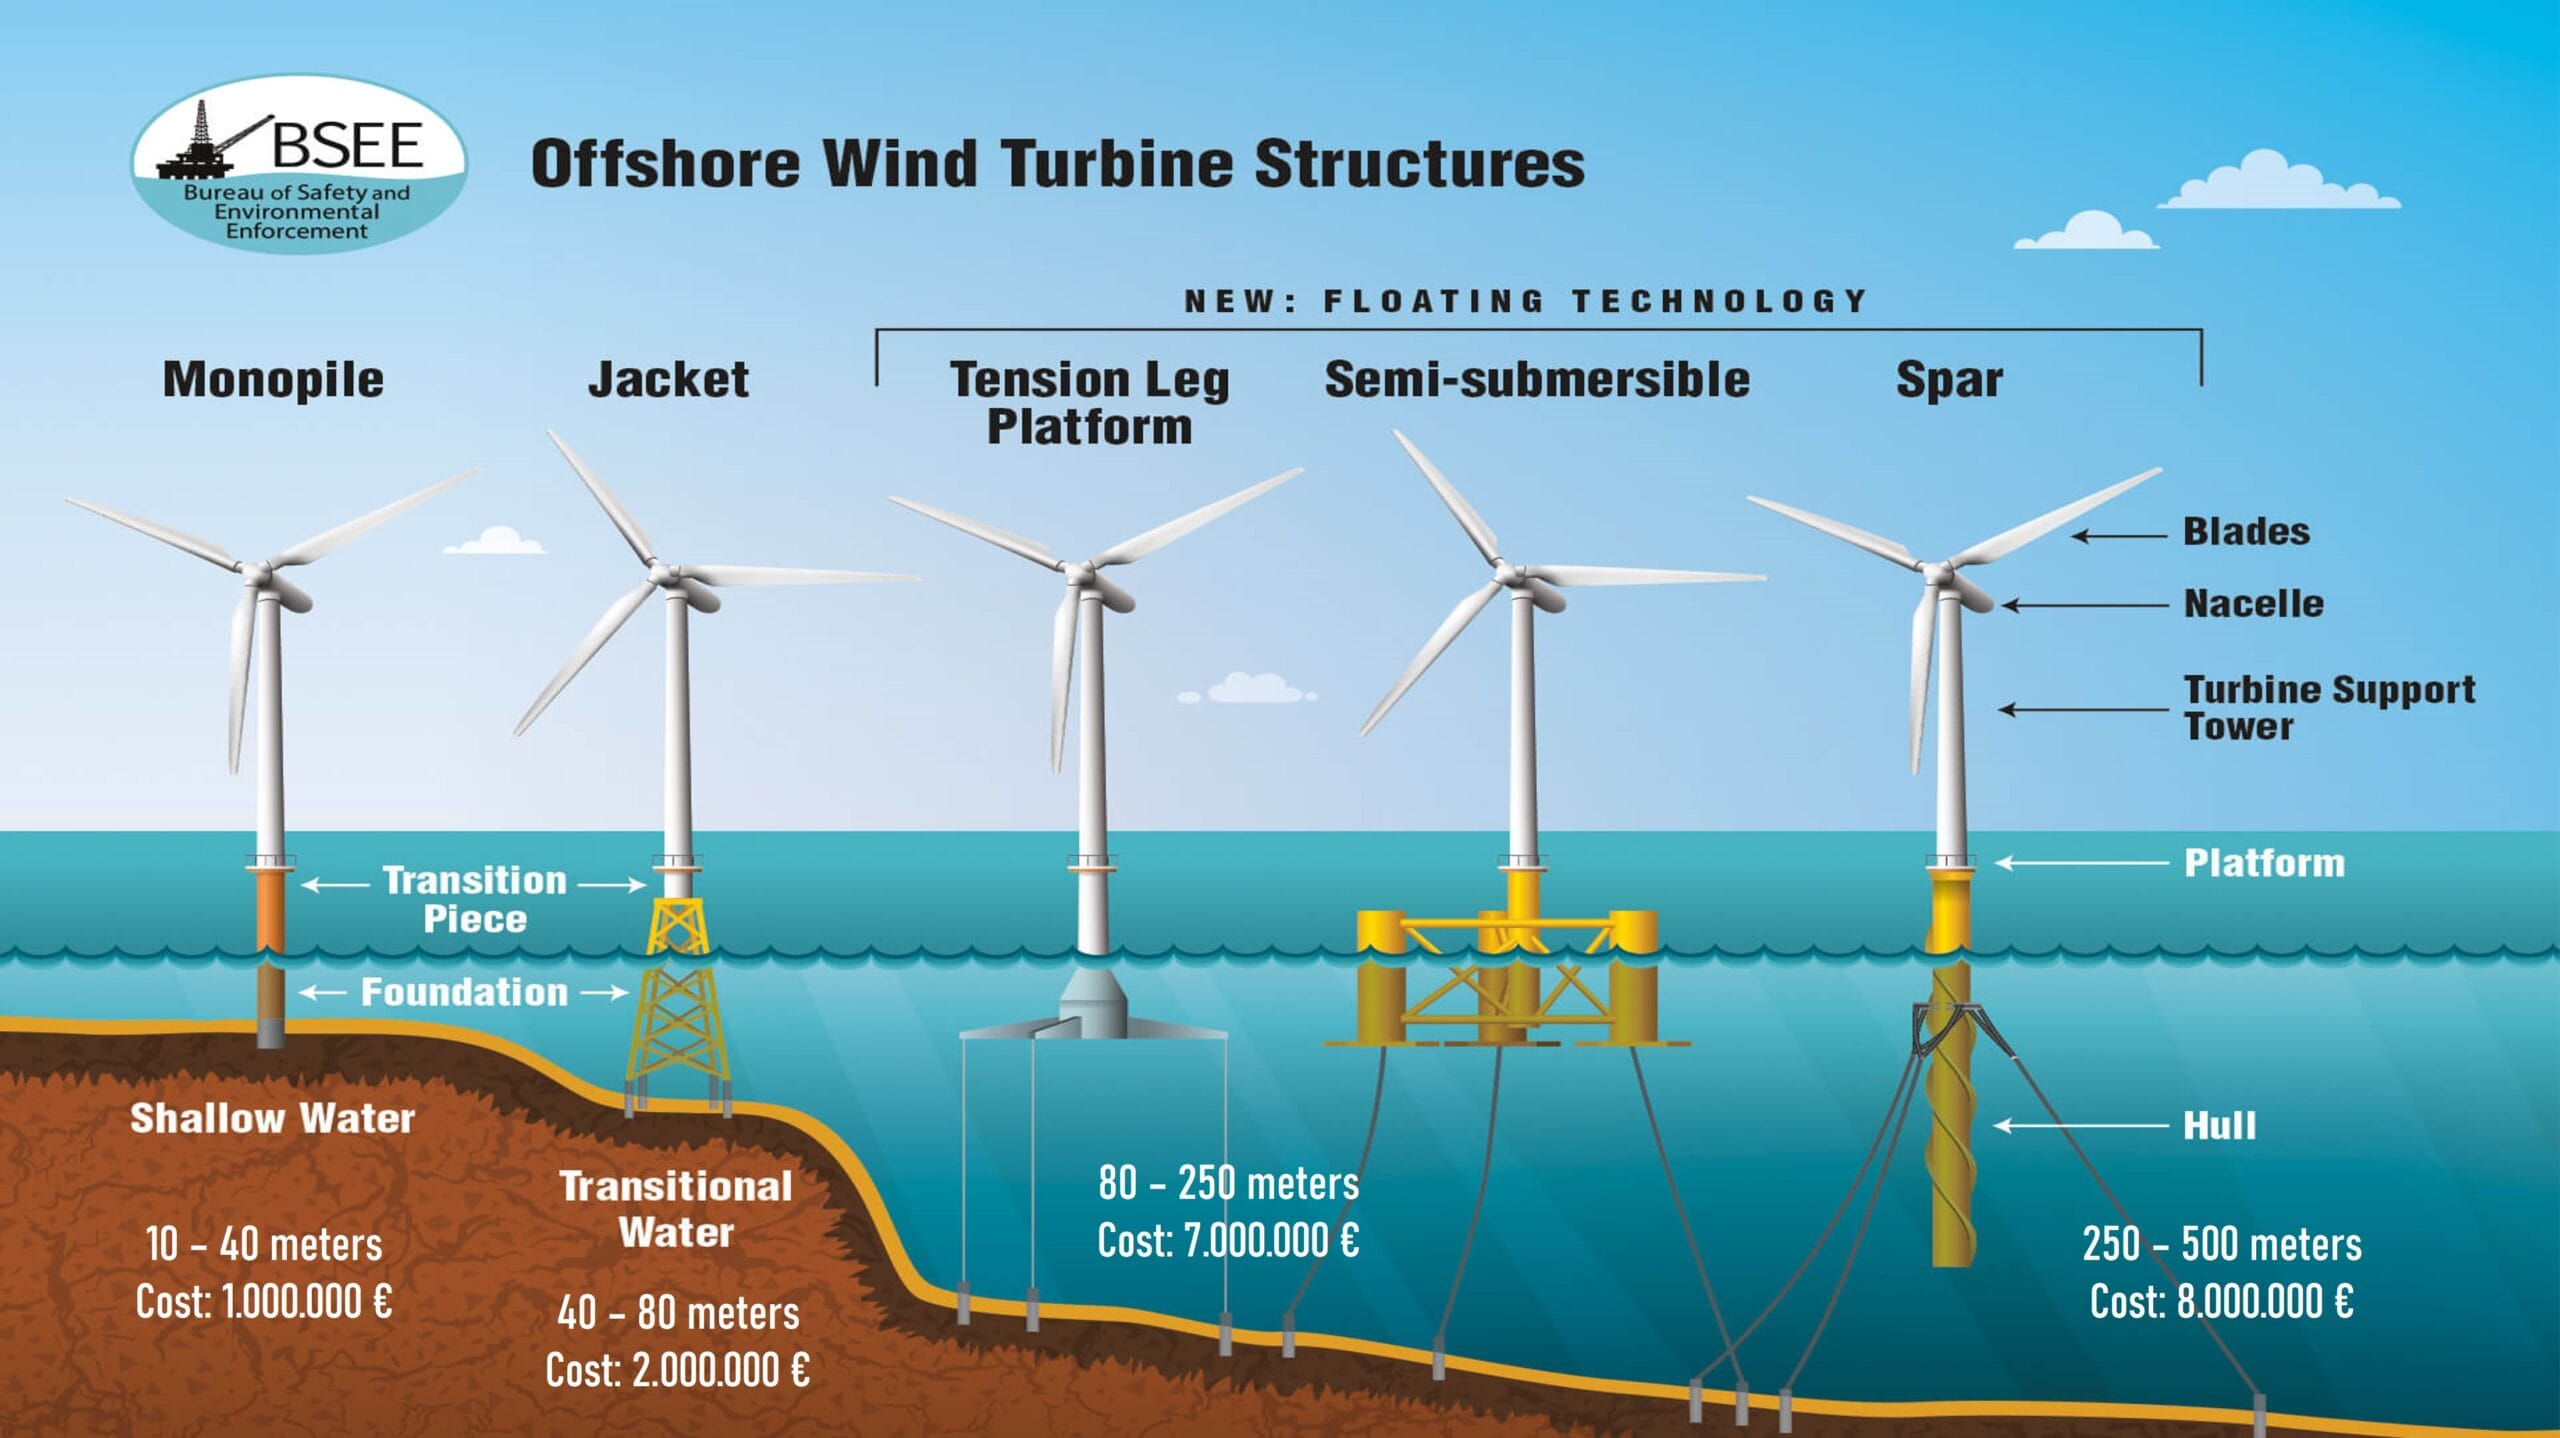
The depth is not a problem for the offshore wind industry, at least up to 1000 meters. The key differences include the foundation type we are going to select and the money we want to spend! Green areas indicate cheaper foundation types like monopile (up to 40 meters), and jacket (up to 70-80 meters) structures. Red areas stand for the floating structures (no. 3 – 6 in the image below) which are 5-8 times more expensive but, we are able to ‘unlock’ windy areas far from the shore!
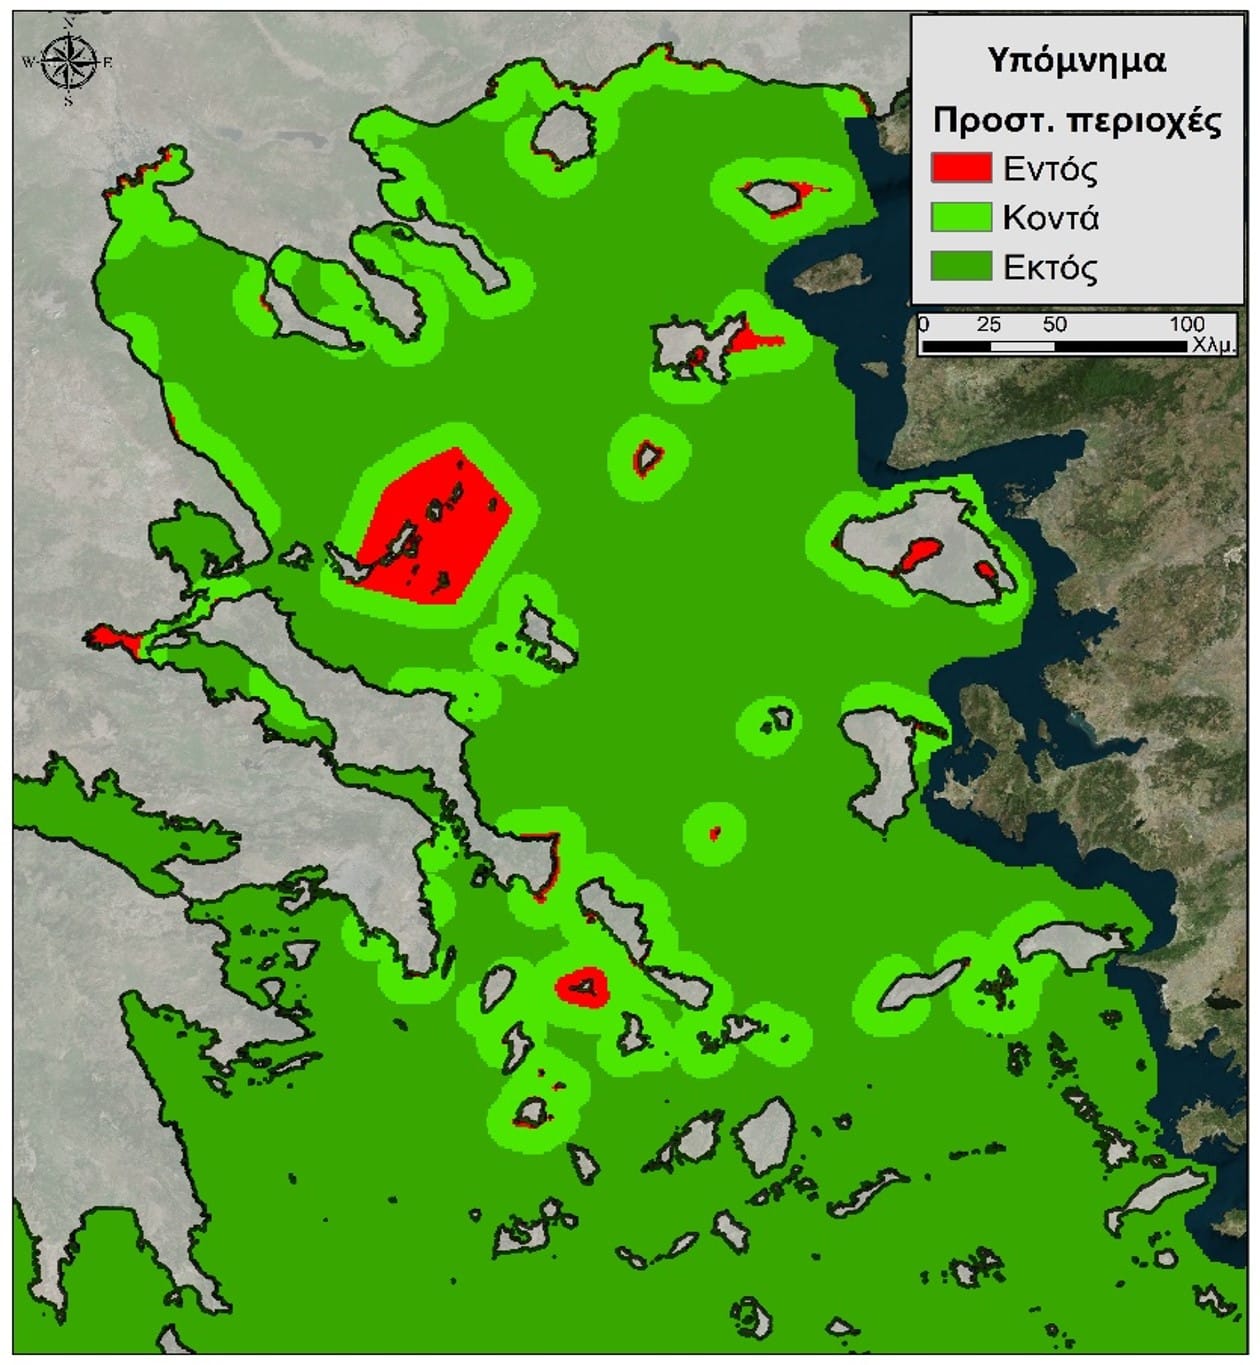
Natura areas
That’s an easy criterion! We want to protect the environment, thus, WE ARE NOT ALLOWED TO GO INSIDE THE RED POLYGONS (Marine protected areas).
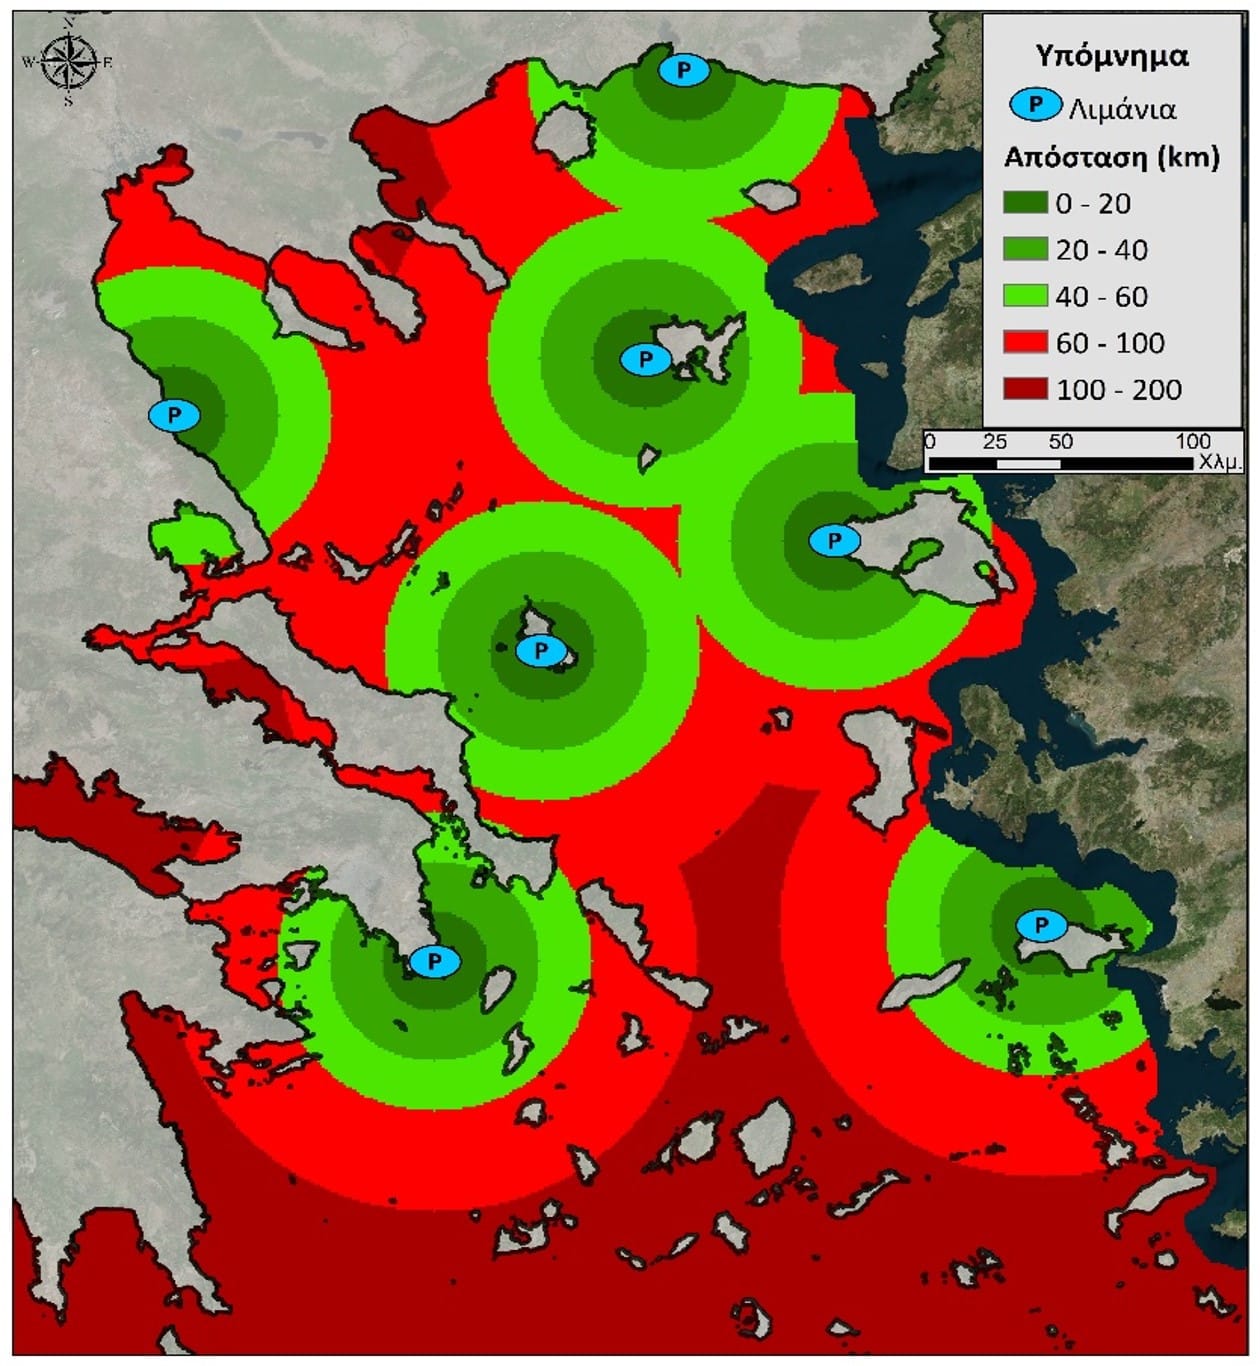
Distance from ports (kilometers)
Most of the times, we want our Offshore Wind Farm to be close to a port/harbor facility (green areas). This reduces the installation, maintenance and decommissioning costs! However, we are allowed to go to the expensive areas (red colors) only if the wind speed in those areas is quite high!
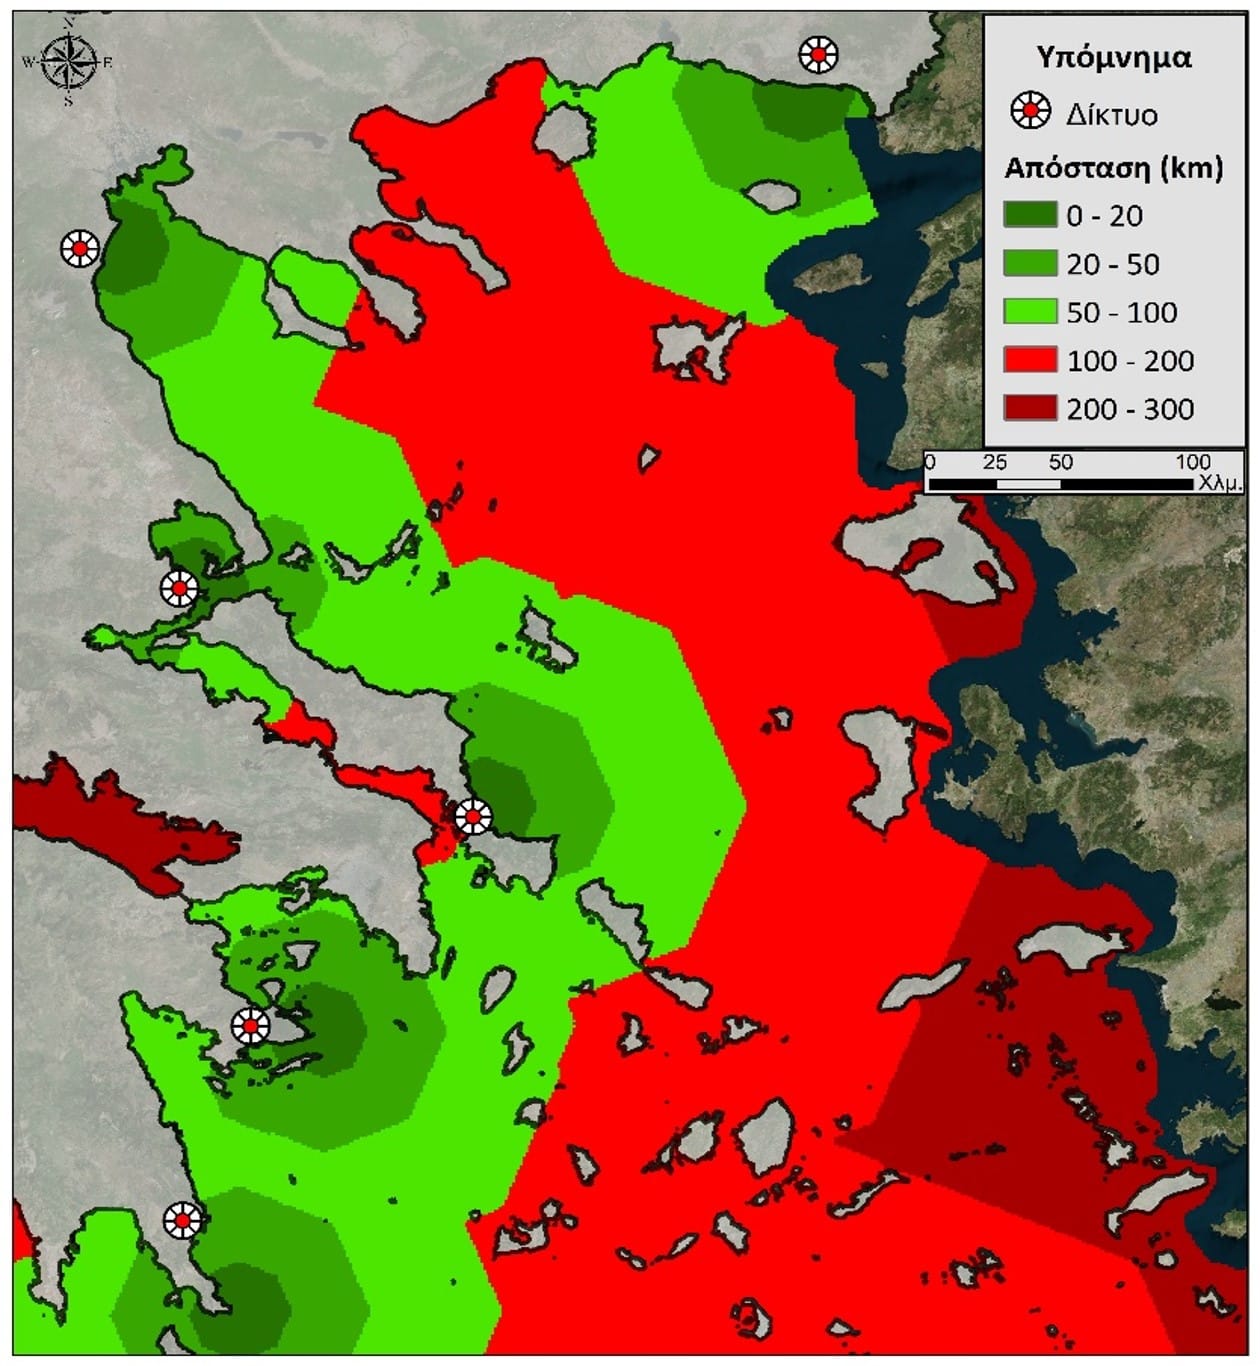
Distance from the onshore grid conncetion points (kilometers)
Like in the ports criterion, green areas indicate cheaper offshore cables (shorter distzances to the grid conncetion points) and red areas more expensive cabling systems. Are we allowed to go to the red areas? Yes, if the wind speed is high! Keep in mind that most Offshore Wind Farms are installed witthin 50 kilometers from the shore!
Step 2: Study area and site-prospecting using the printed maps above (2 lesson, 1 hour and 30 minutes)
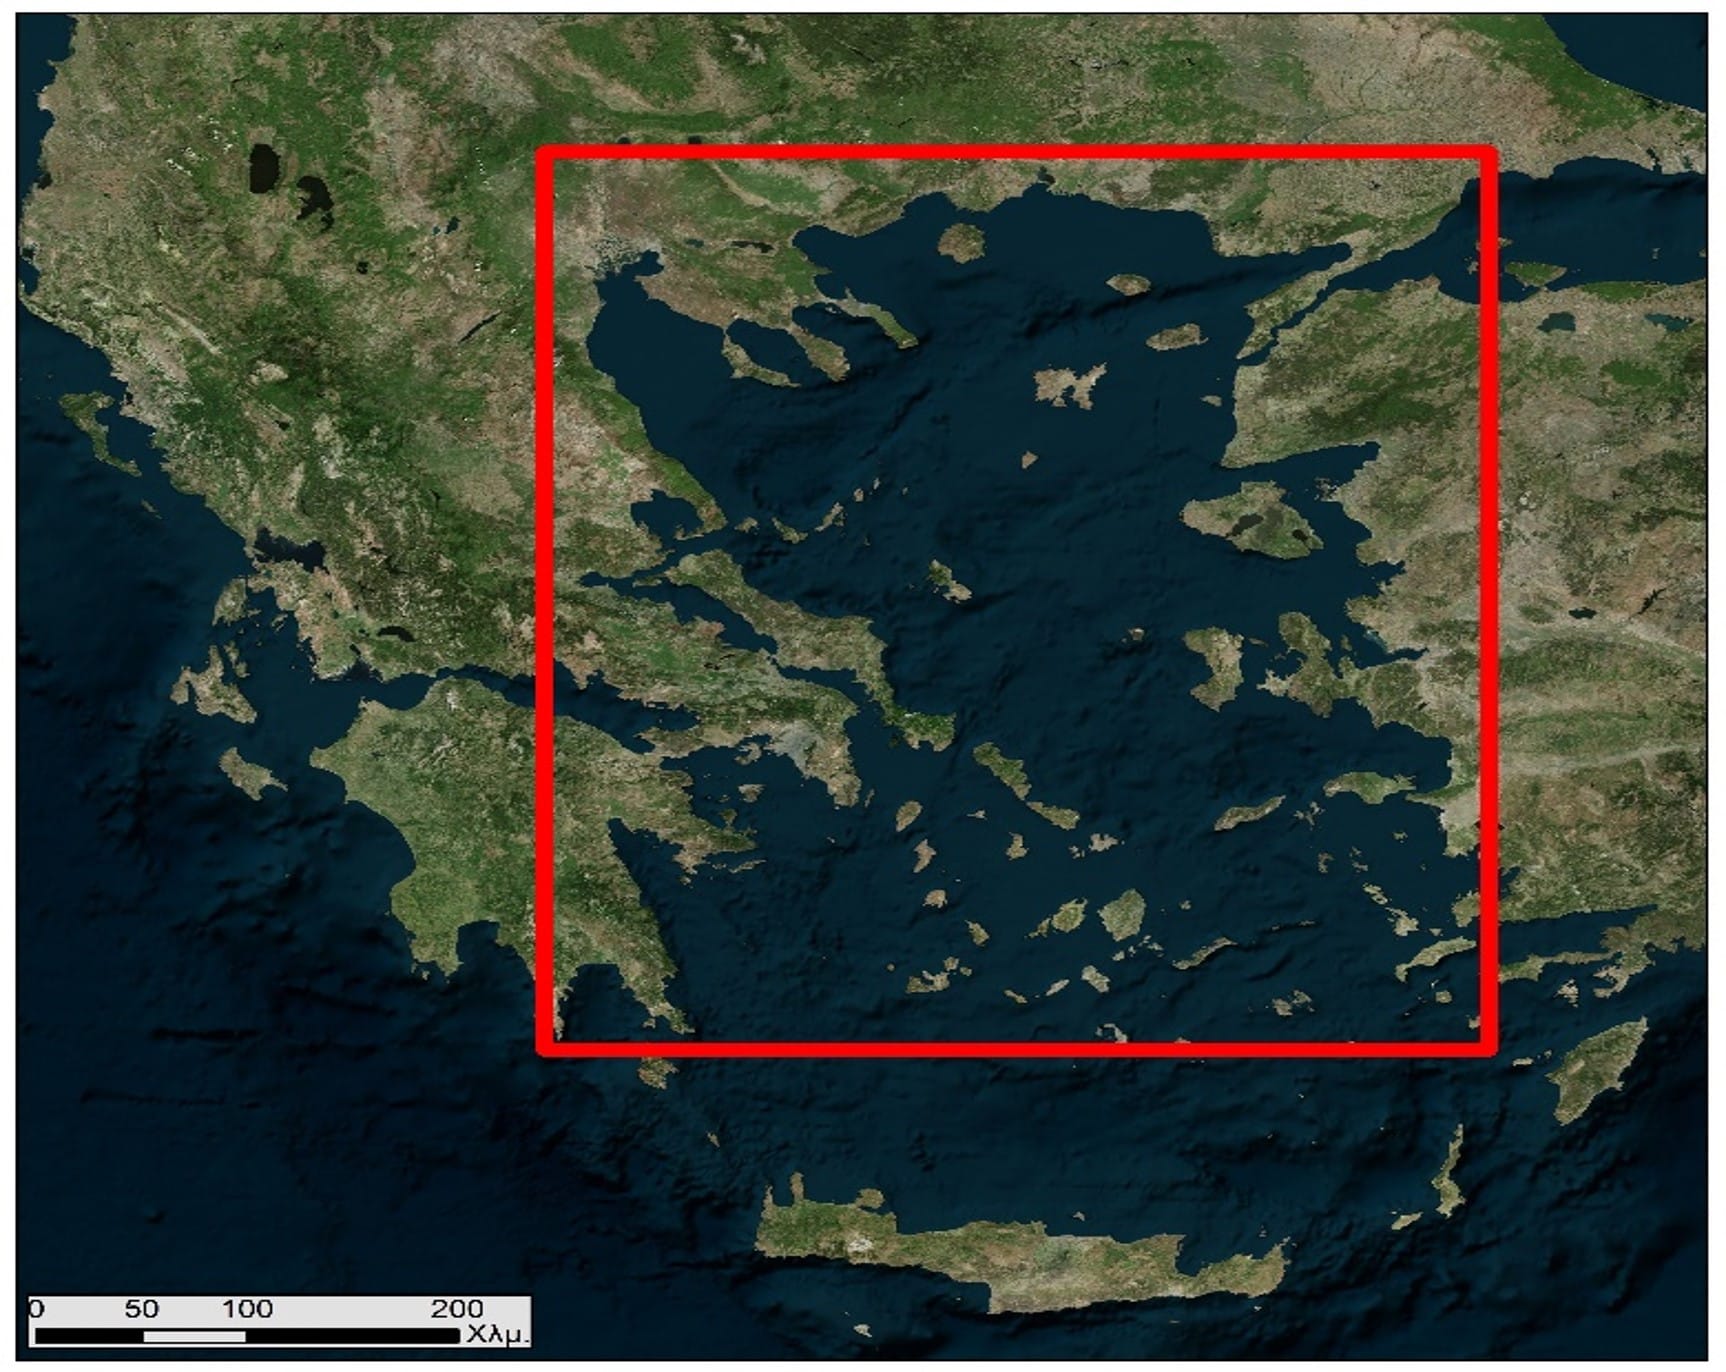
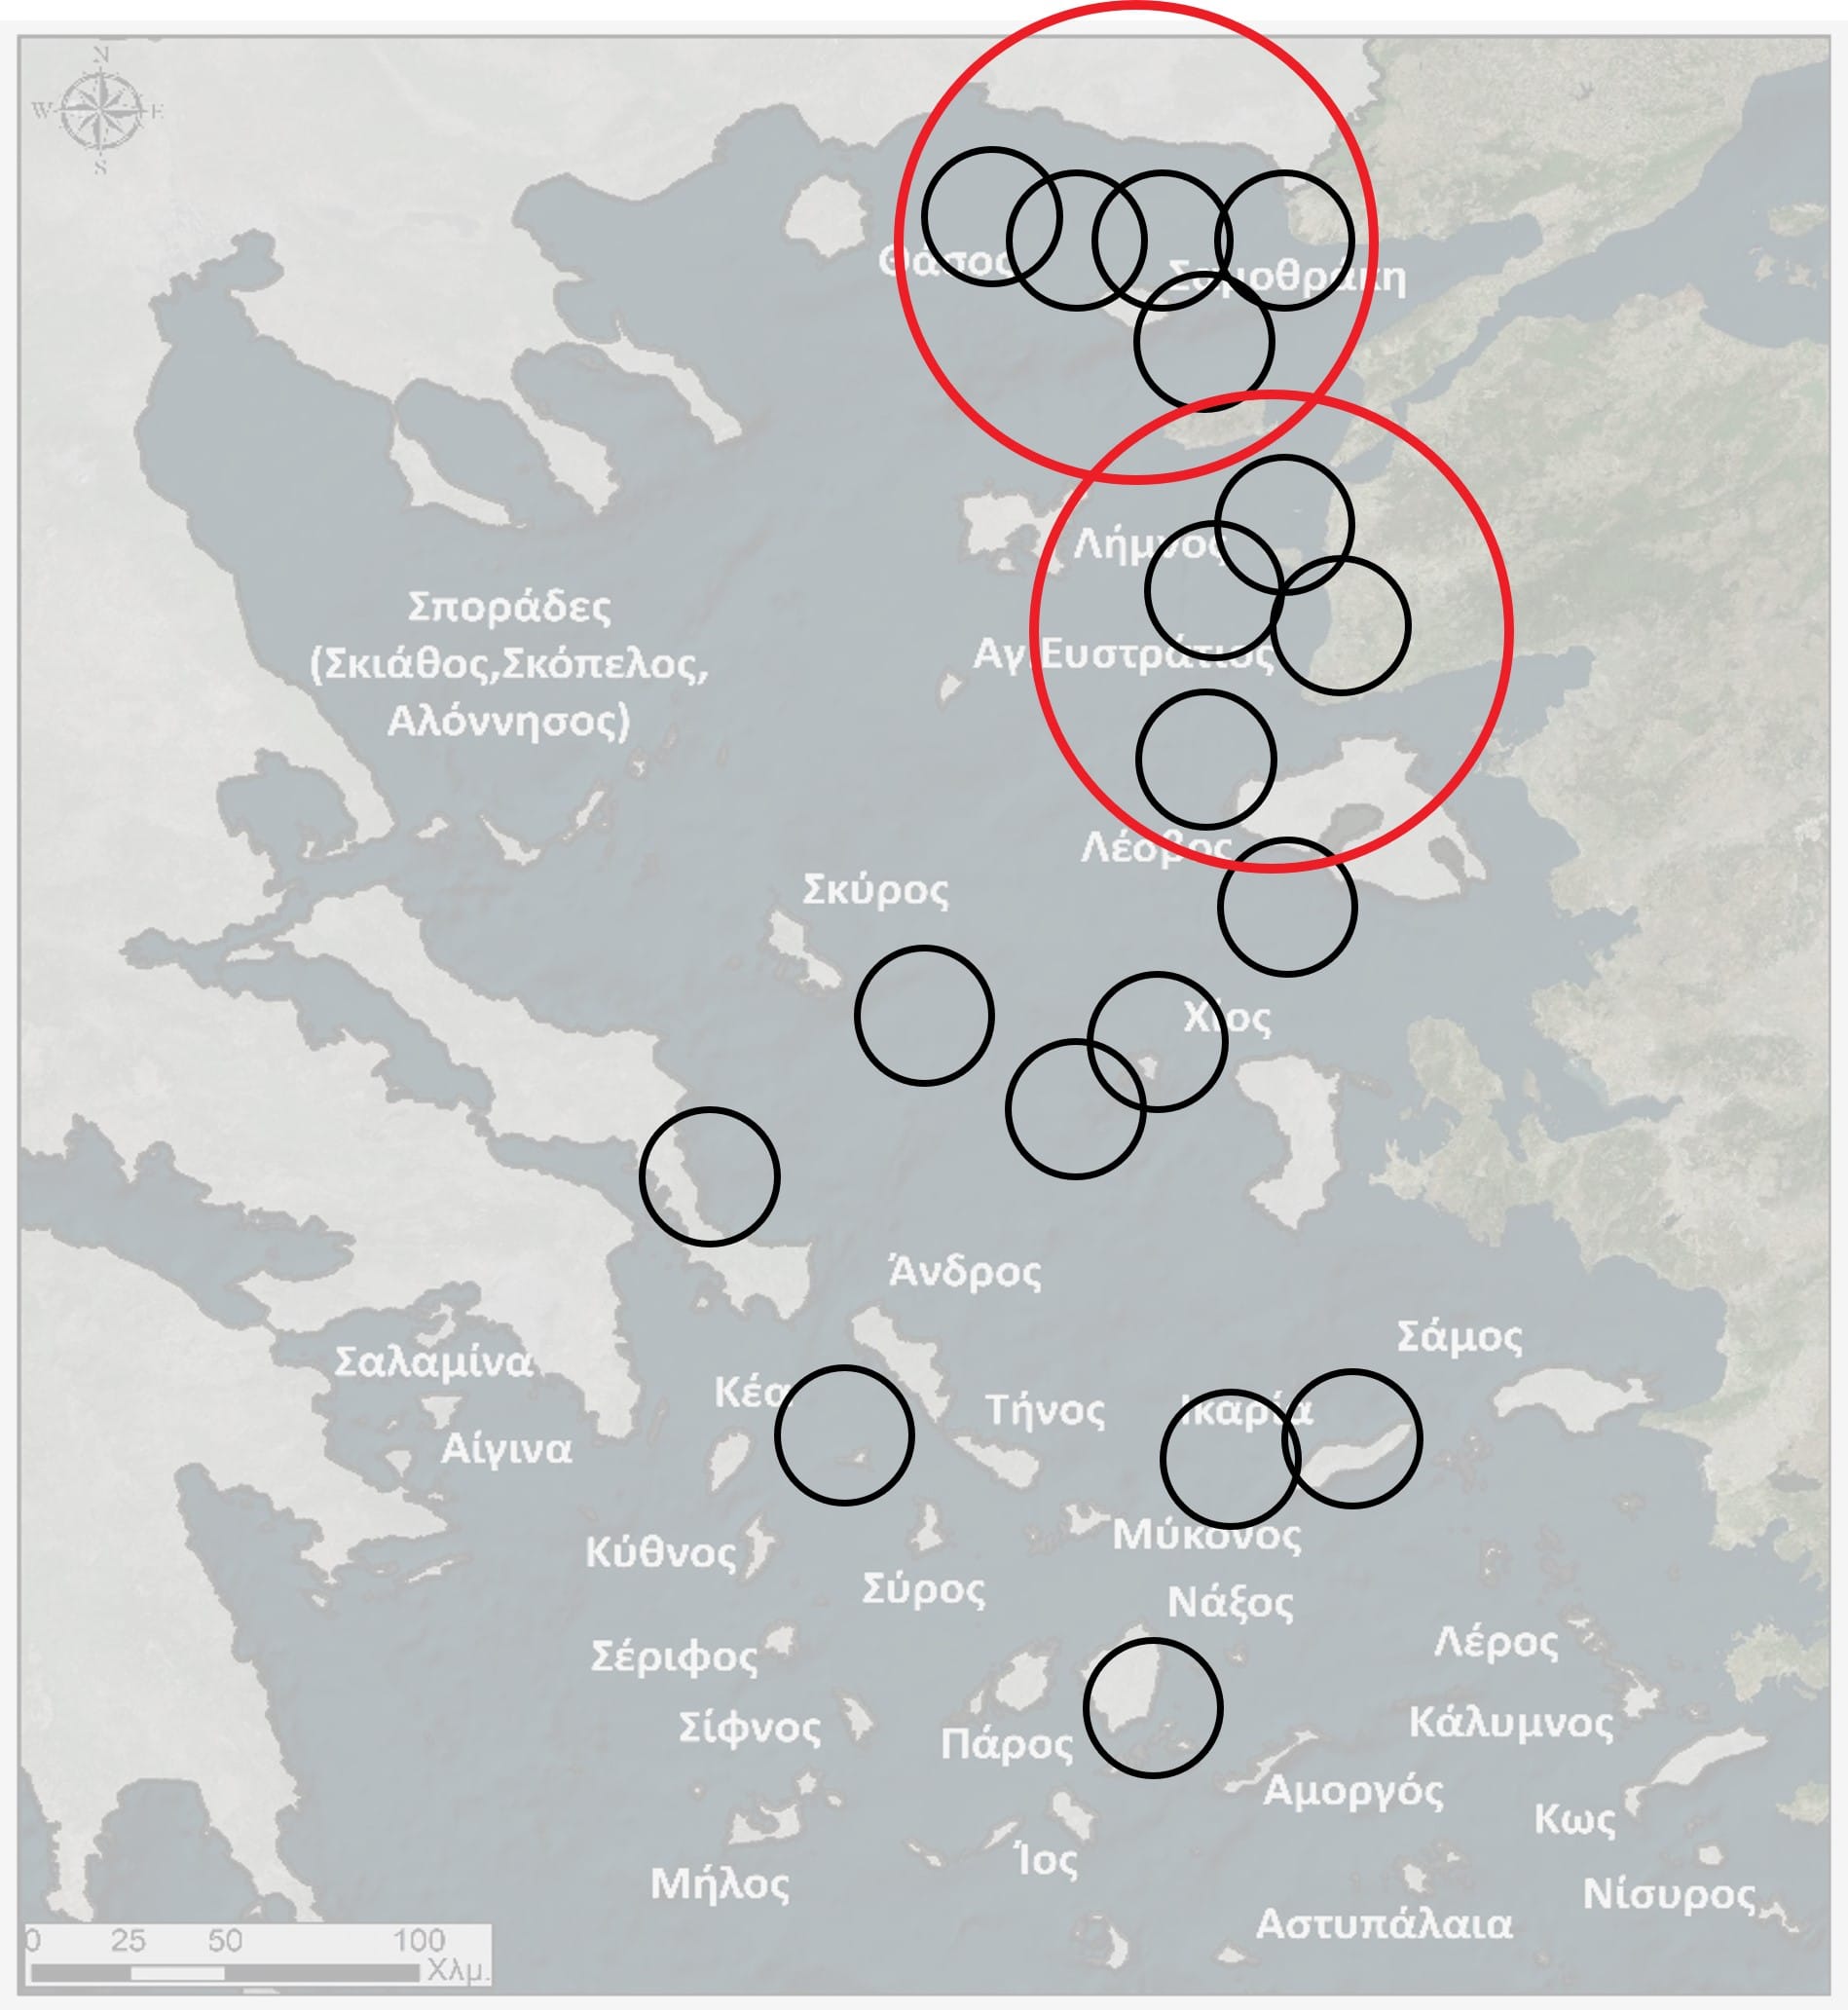
Study Area – Central and North Aegean
Students are presented with the geographical context. This map likely shows the main islands and marine space under consideration. It grounds the activity in a real region and helps students begin thinking spatially about where energy infrastructure can and should be developed.
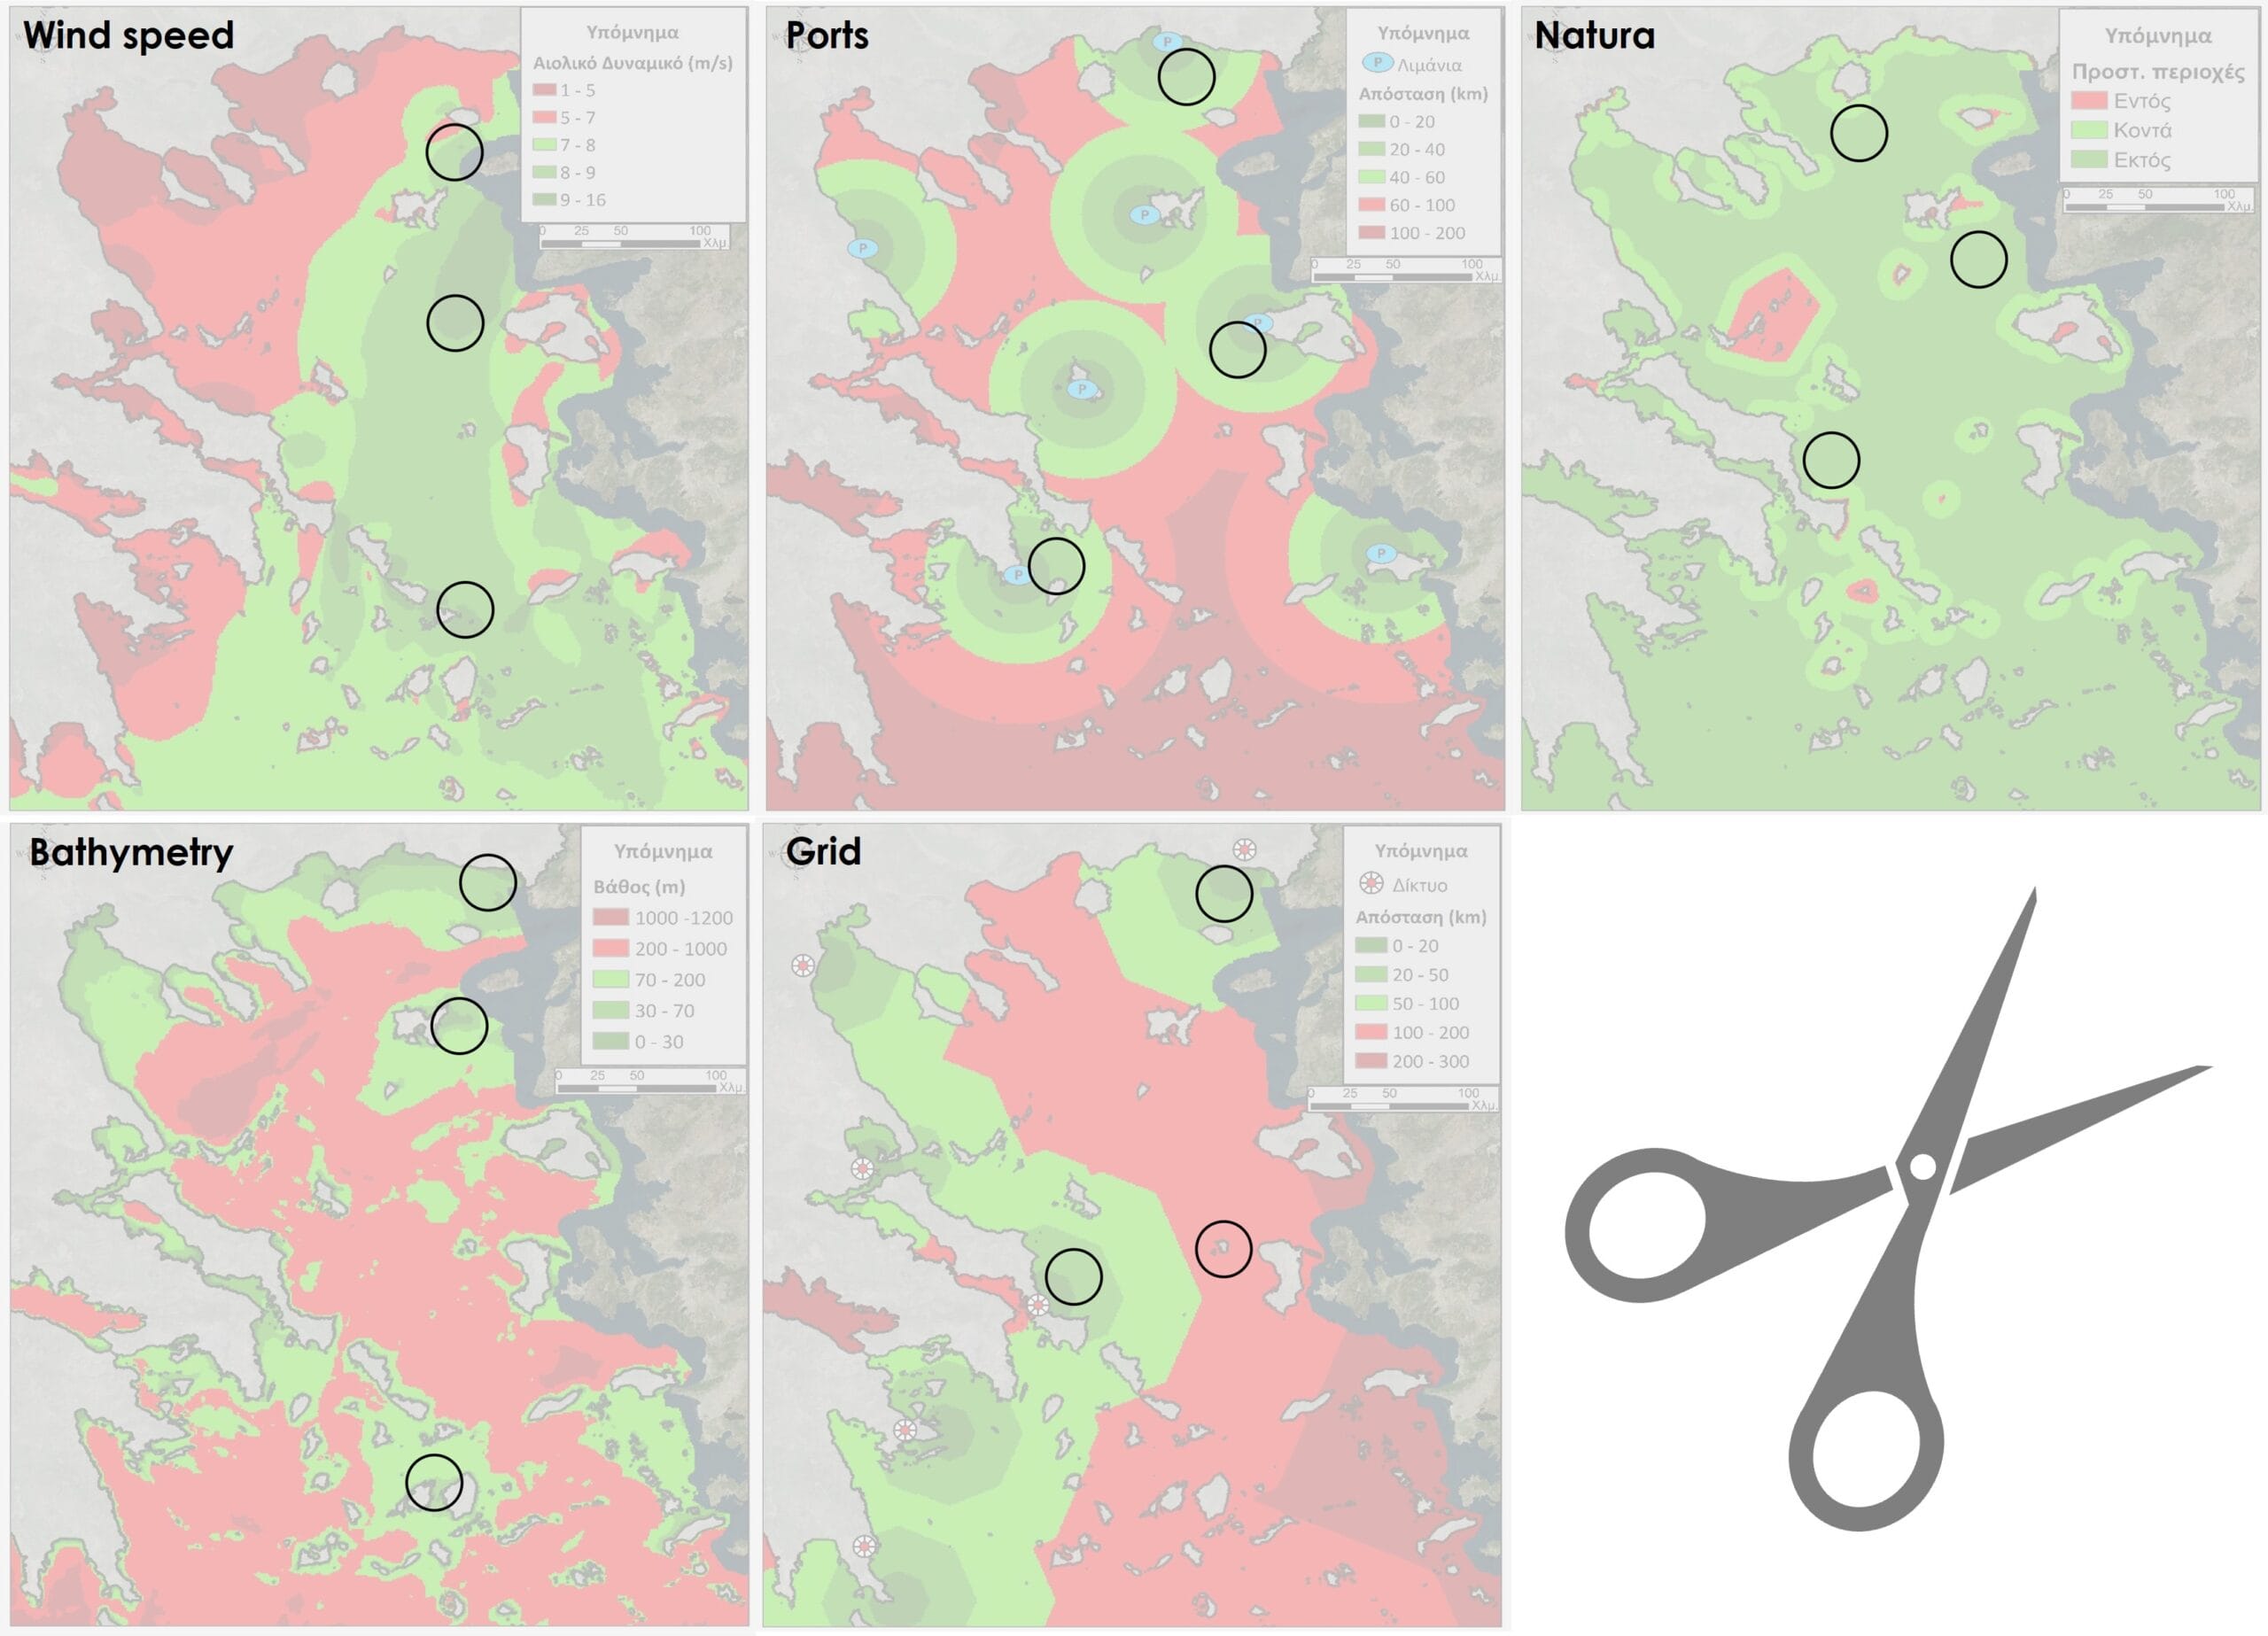
🧠 Activity logic: Students draw small circles on each printed map (on tracing paper), marking areas they believe meet the criterion best. Overlaying all five tracing papers reveals intersections—candidate sites that satisfy multiple criteria.
We divide the students in groups of 2-4 and we share the printed maps (5 maps per group). The key objective is:
- The students discuss in groups which areas are the best per criterion and they select a minimum of 3 areas for the wind speed, bathymetry, Natura, and distances from the ports and onshore grids respectively.
- They draw 3 circles on each map (1-euro coin size) using tracing paper (we need 5 tracing papers or at least 2 big ones covering gropus of maps) overlayed on each printed map. We also draw each map’s borders (rectangle)
- We cut the tracing papers and we write down each criterion’s name on top of the rectangle so that we know which criterion is linked to each one of the tracing paper maps.
- We overlay the tracing papers and we try to identify in which areas, the circles are more and close to each other. In a nutshell, if we have a lot of circles being intersected, probably that’s the best area in the Aegean Sea, combining all the criteria.
The students cut and overlay the tracing papers….
Let the students decide which area they prefer and why. Let’s move on to step 3.
Step 3: Building our Offshore Wind Farm and estimating all costs (2-3 lessons of 45-minutes each).
Energy Demand Table (Houses per Island/City)
This table below supports the next step: estimating how much energy each island or city needs. Once students select a potential Offshore Wind Farm location, they choose which areas it will serve. They then estimate how many wind turbines are needed based on household demand and turbine capacity (coming in the next slide).
In the exemplary case of Greece, in order to estimate the number of the Wind Turbines with provide 2 levels of information. First, the number of houses in different areas of Greece that we want our Offshore Wind Farm send the energy produced.
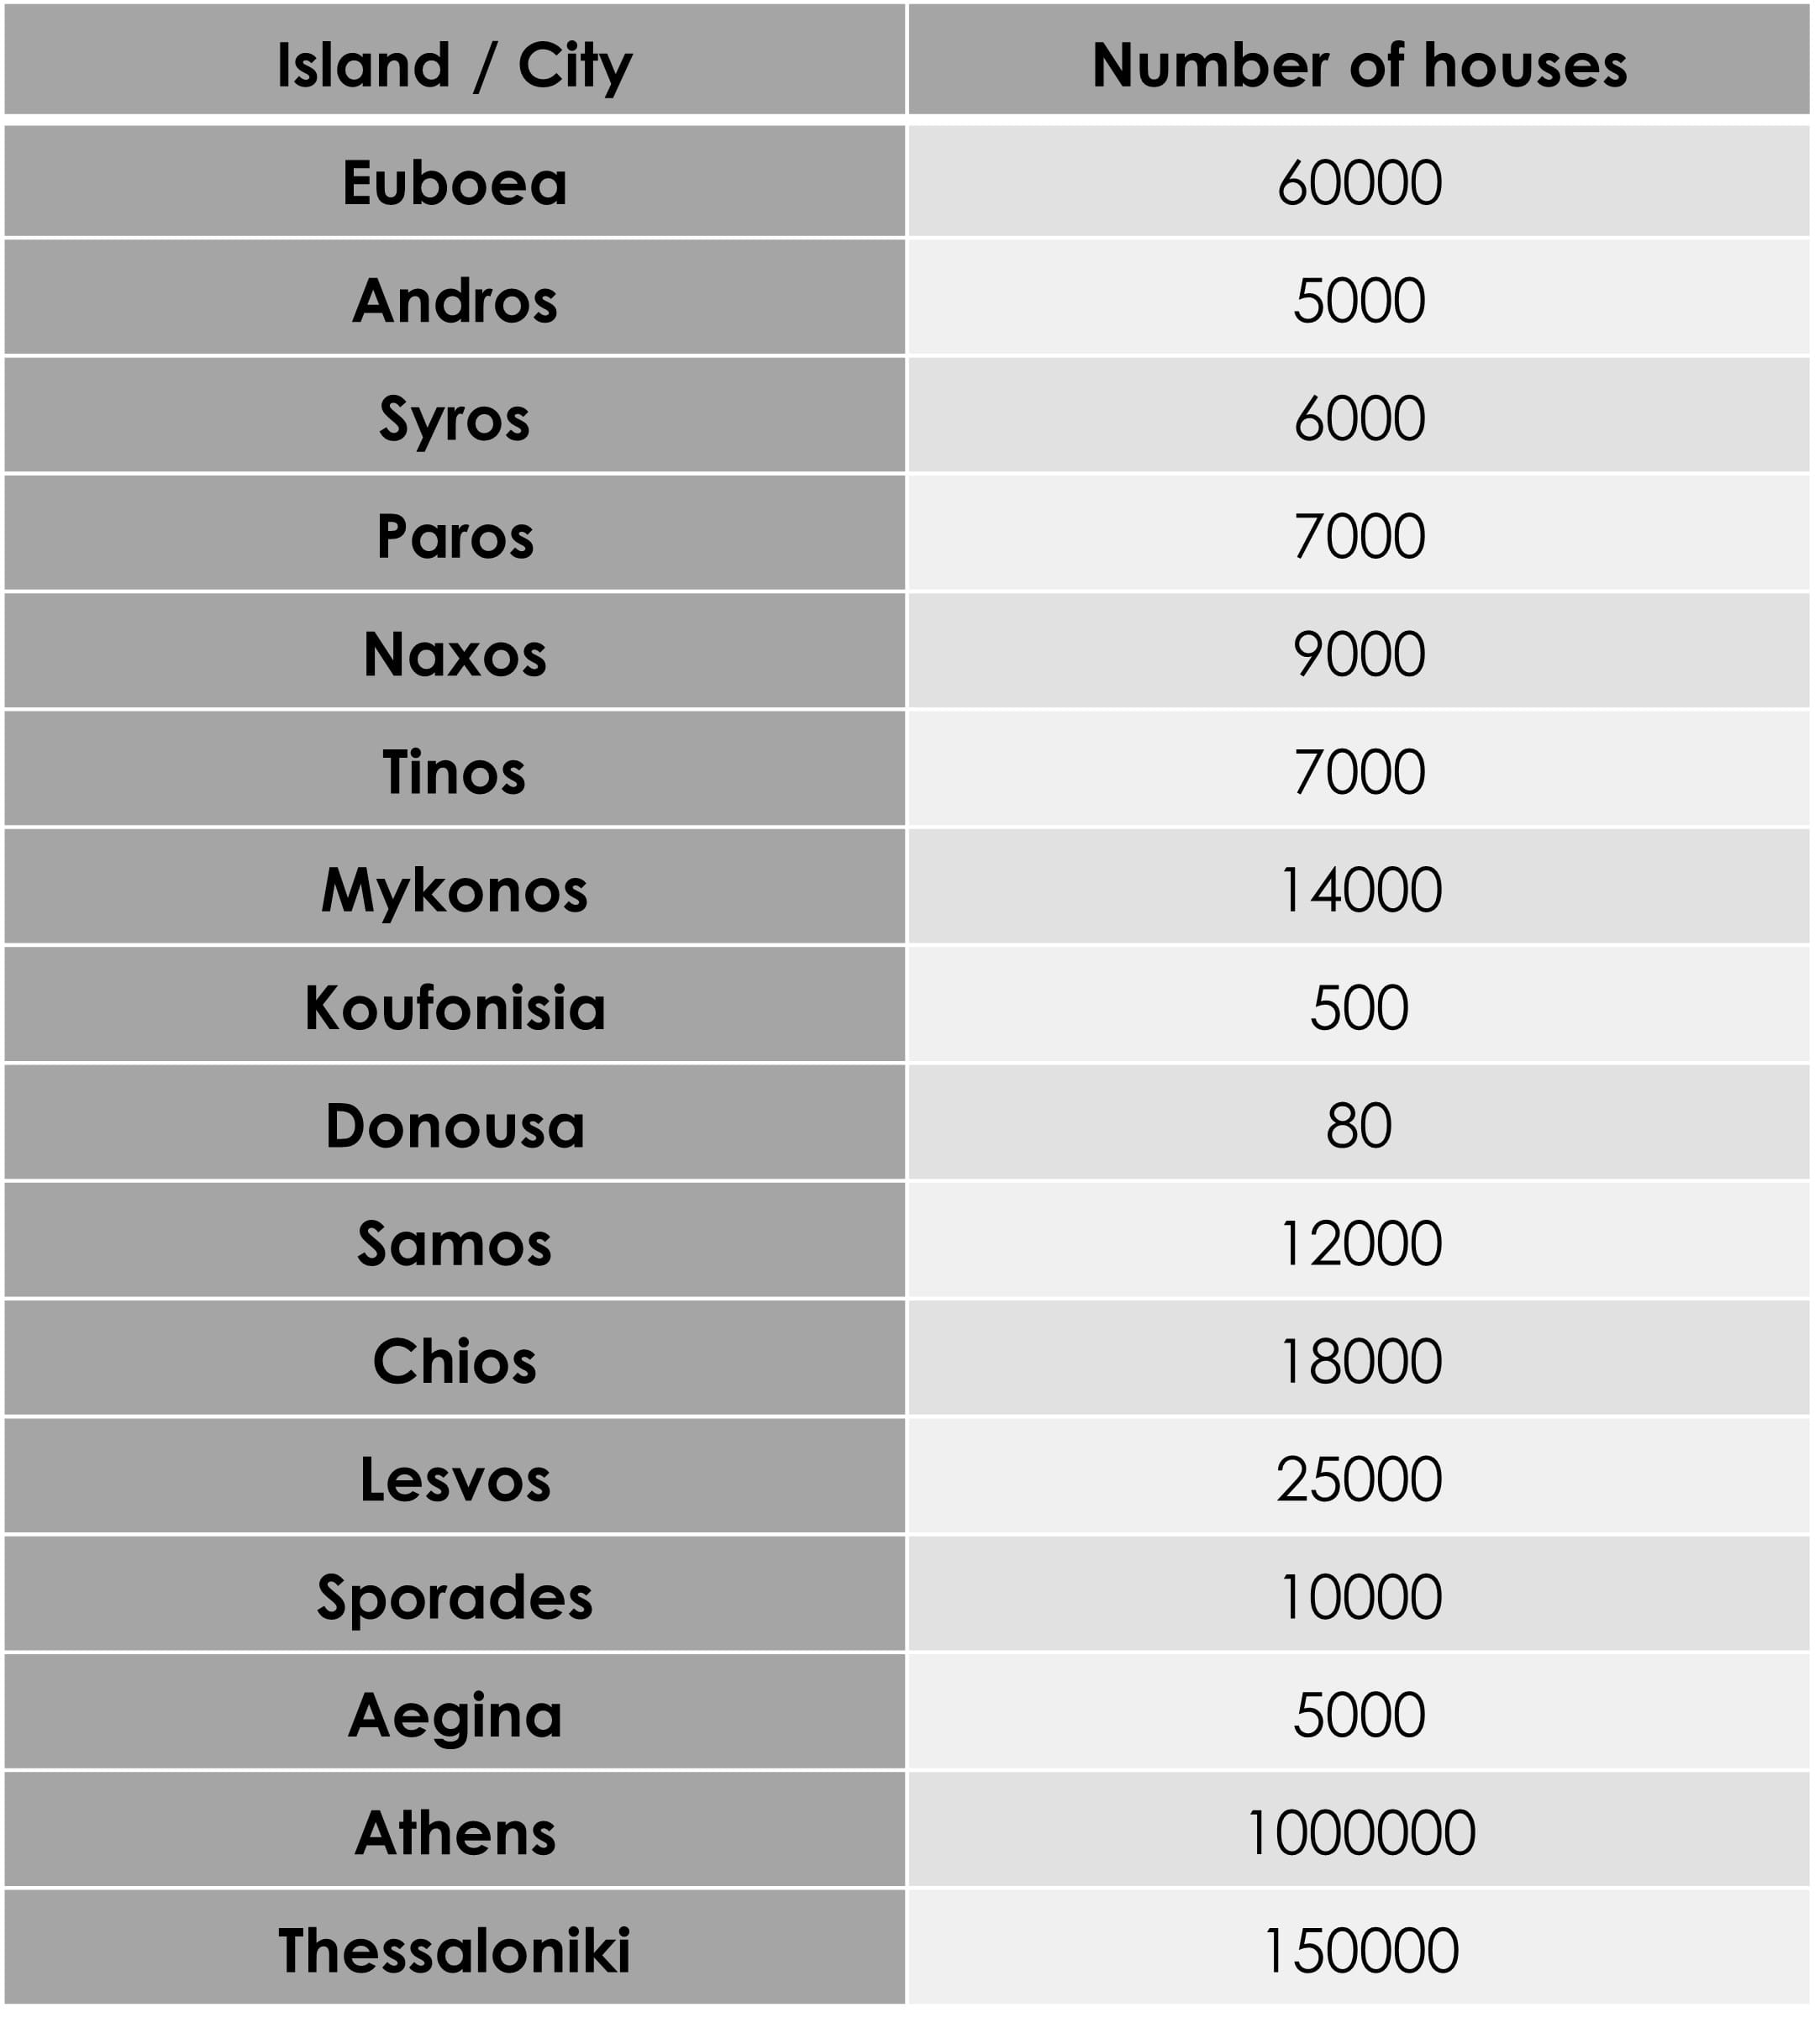
Some ot these areas are big cities (i.e. Athens or Thessaloniki) and some others, smaller or larger islands. The students may combine both and for example, to support Athens and the Aegena island close to Athens. To estimate the number of the Wind Turbines, we share the first card!
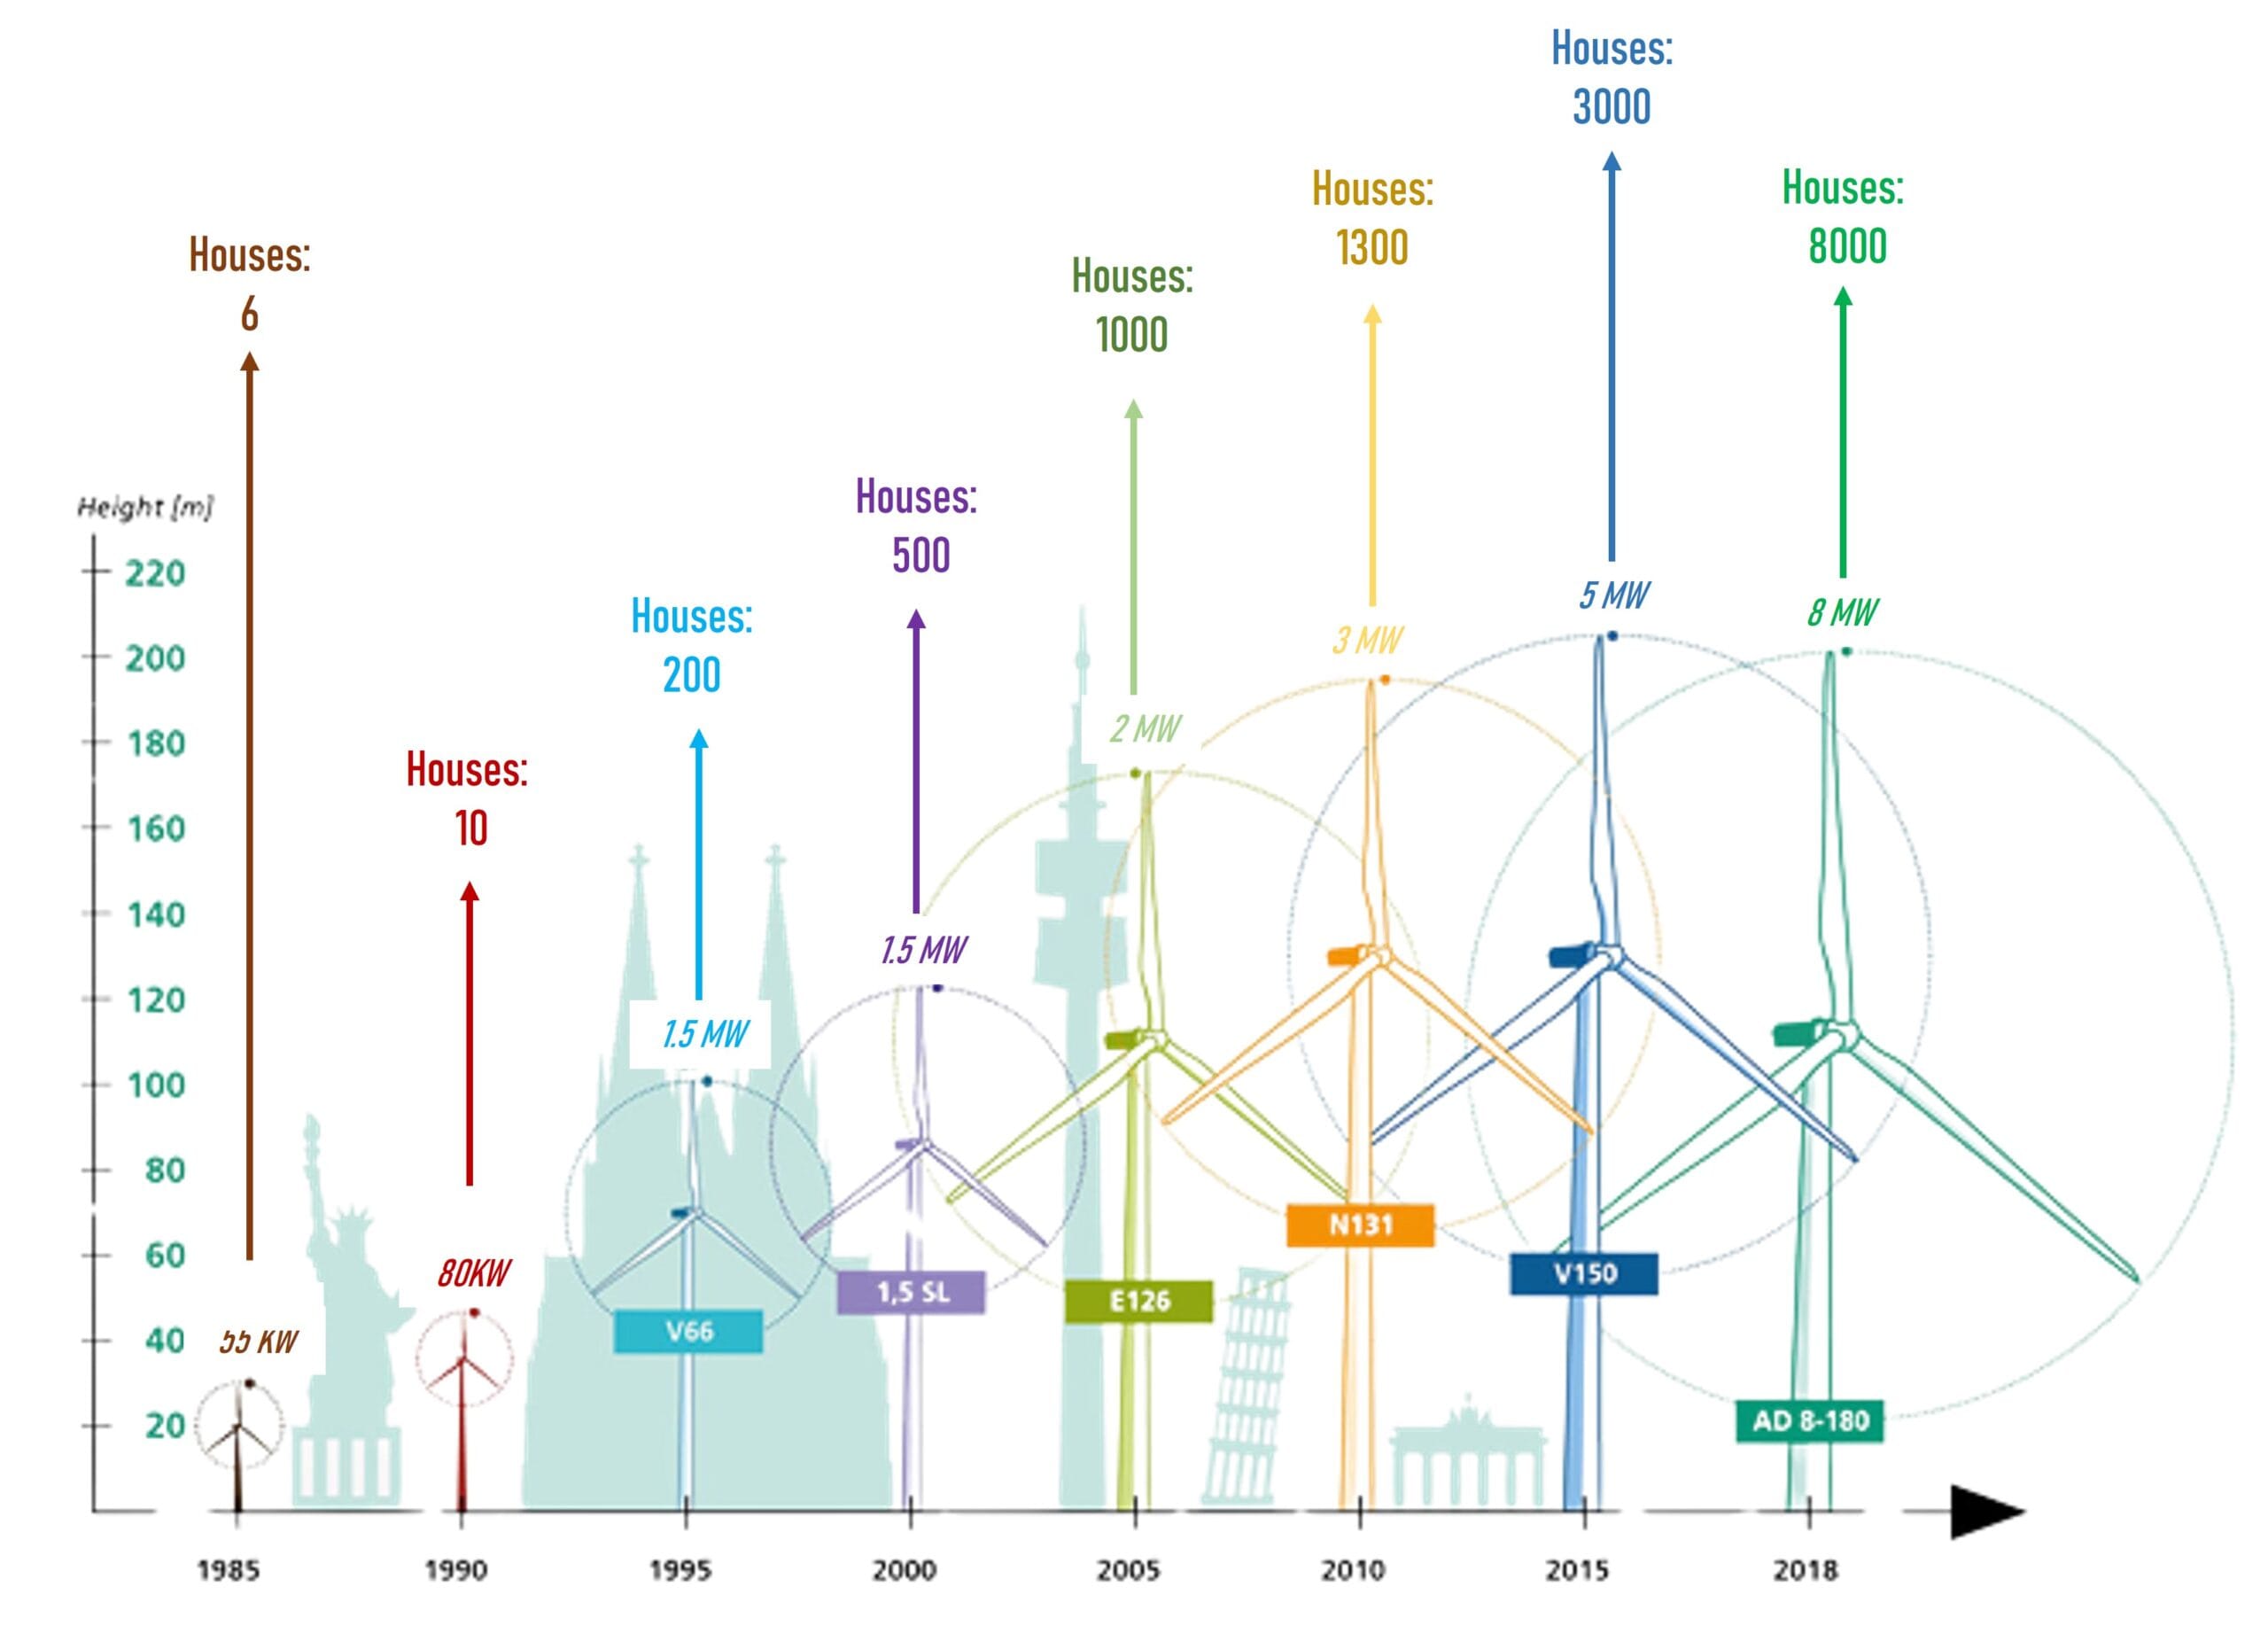
Depending on the area the students selected, i.e. windy or less windy area, they may select the size and type of the wind turbine. They divide with the number of houses they want to send the energy produced and they calculate the number of the wind turbines in their farm.
Next, we estimate all costs! To do that, we need a series of cards with the cost breakdown (i.e. wind turbine, foundation and cables).

For estimating the cable length, we use Google Earth Pro:
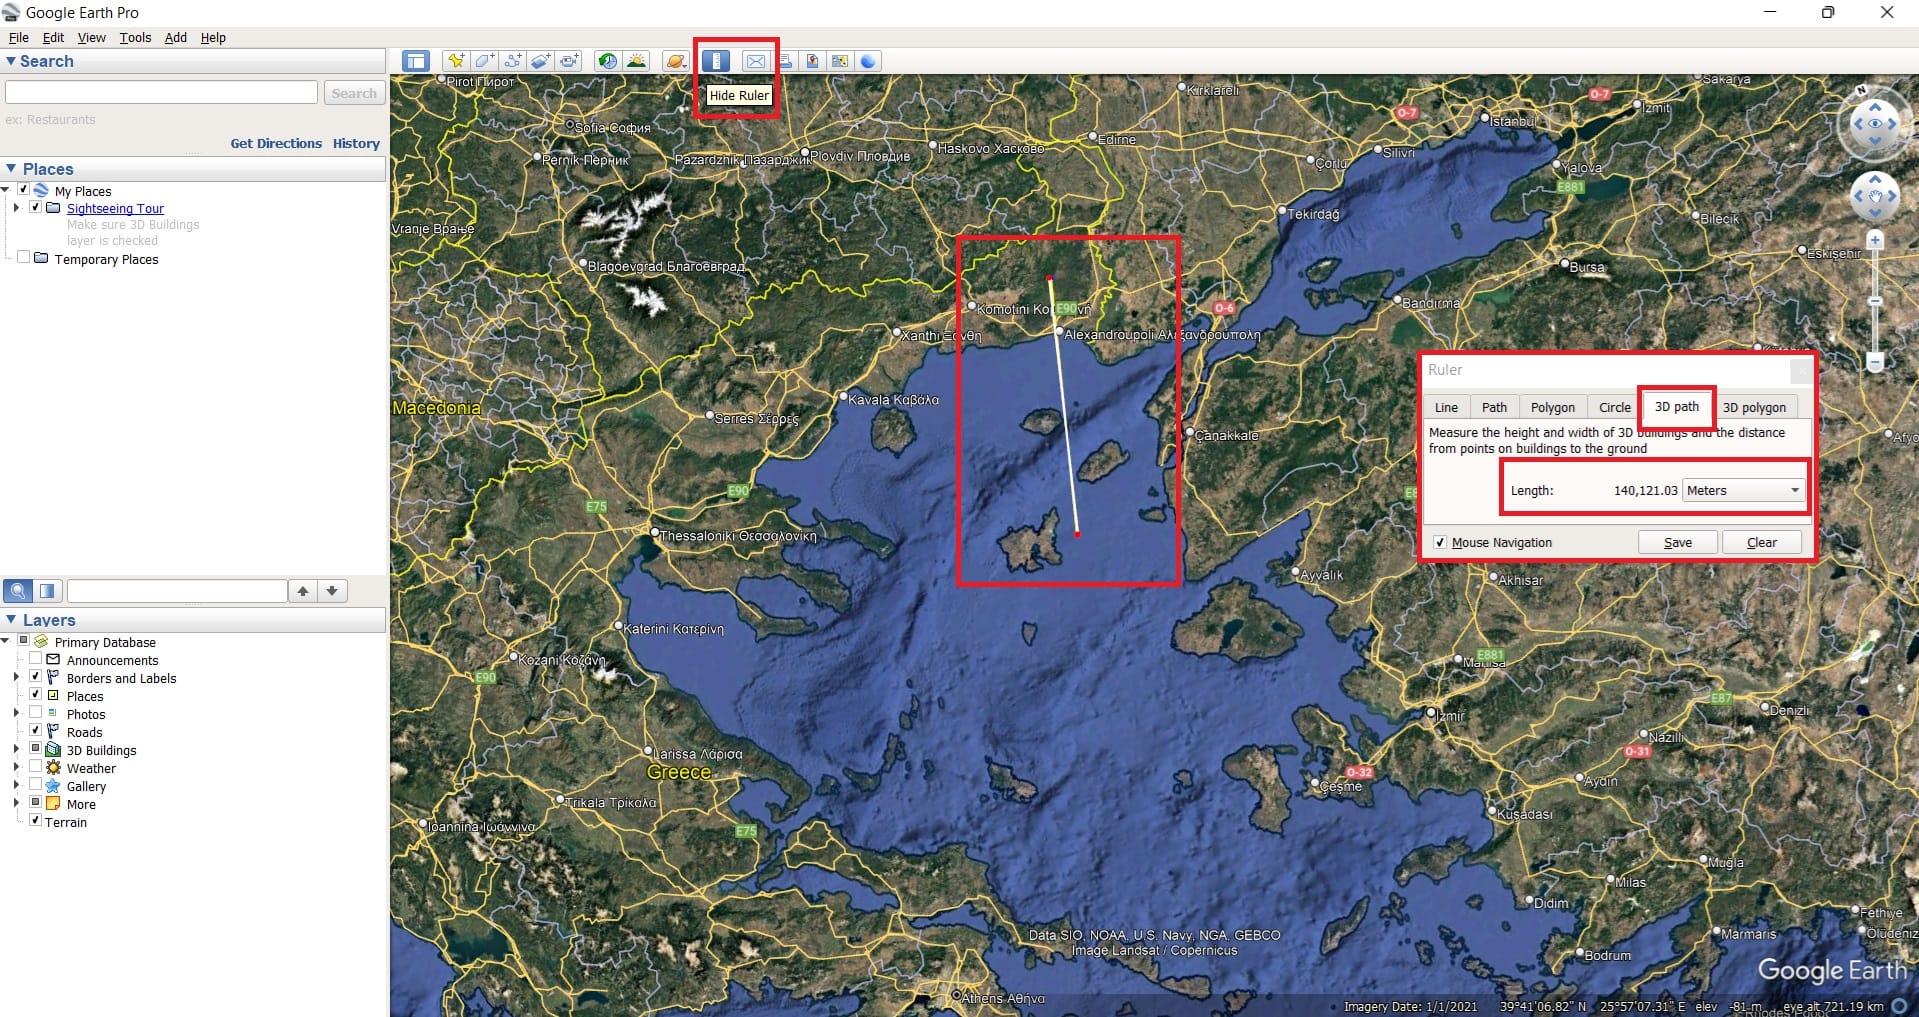
If we download, install and open Google Earth Pro, we can measure any distance we want (either in 2D or 3D) using the ruler (see the image above). Now that we have the cable length, i.e. 140121 meters, we give to students the next cost card!
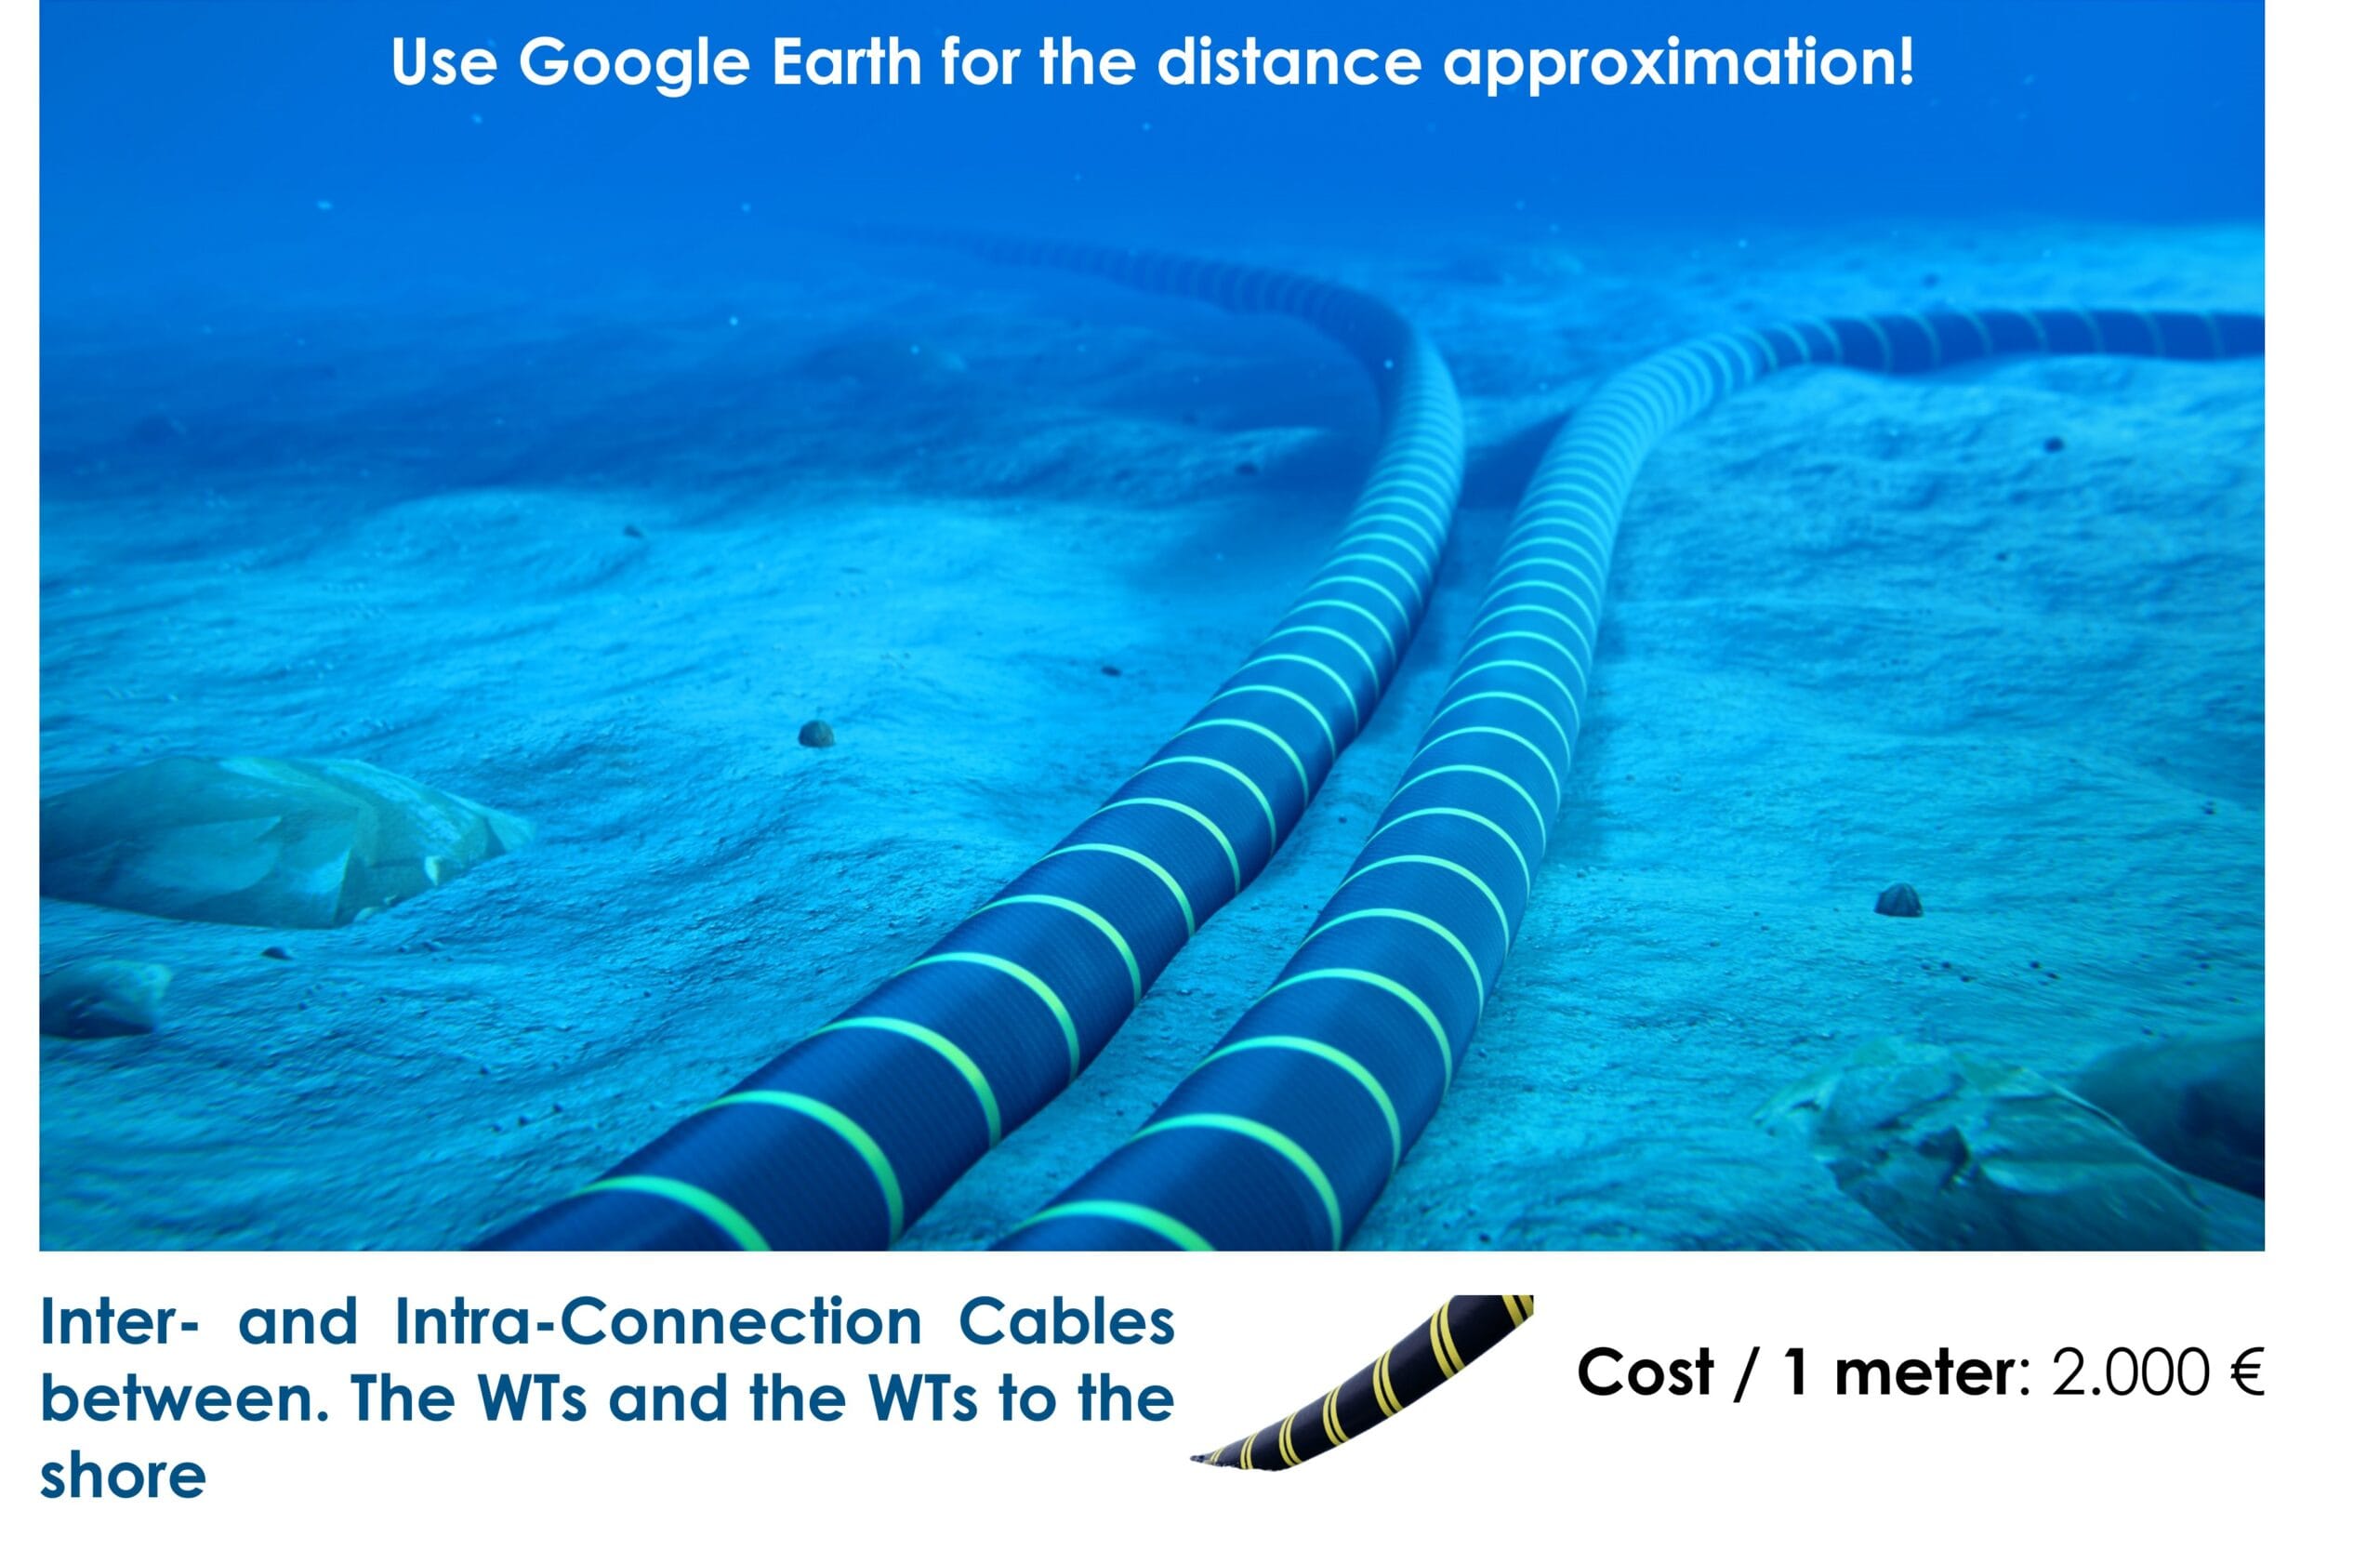
The cable cost is approximately 2000 euros per meter. If we calculated the length as 140000 meters, the total cable cost will be 280 – 300 million Euros!!
So, until now, let’s say that we built an Offshore Wind Farm consisting of 40 wind turbines. Our costs are estimated as:
- 40 x (8 million for a big wind turbine) + 40 x (2 million for jacket foundations up to 80 meters depth) = 400 million Euros
- Plus 300 million Euros for cables
- Plus the nature-inclusive design concepts we are going to use for protecting the marine environment (fish, mammals and natural habitats).
First, we explain what nature-inclusive design is! You may use the following video and the image explaining how nature-inclusive design helps protecting (partially) the ecosystems.
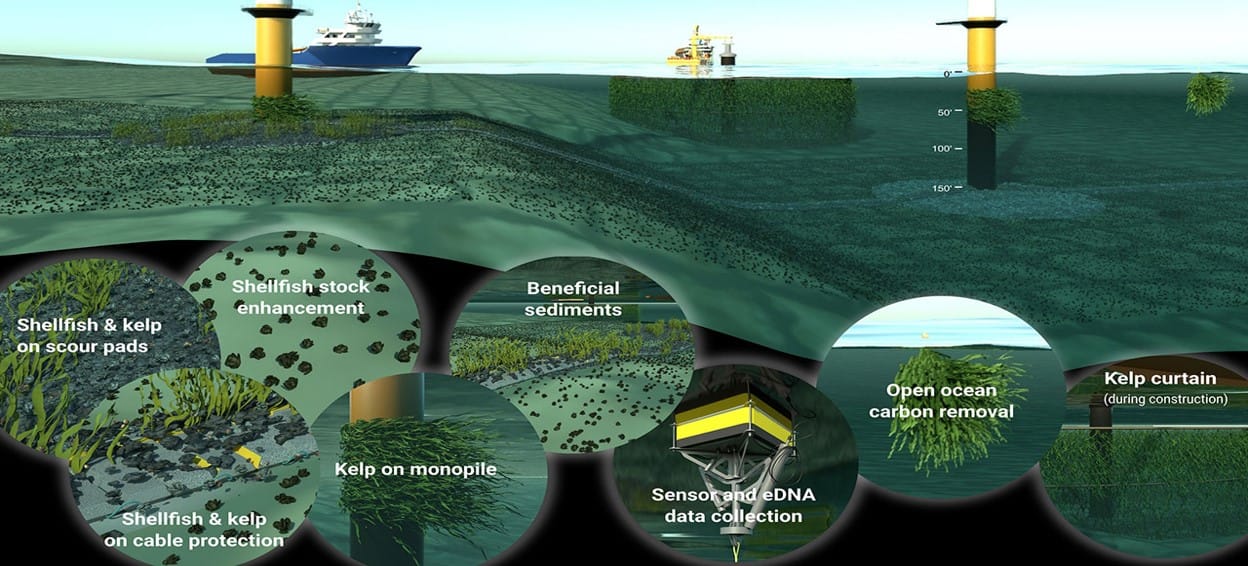
Let’s give to students the next series of cards! The first card explains different types of artificial reefs attached on the foundation of each turbine.
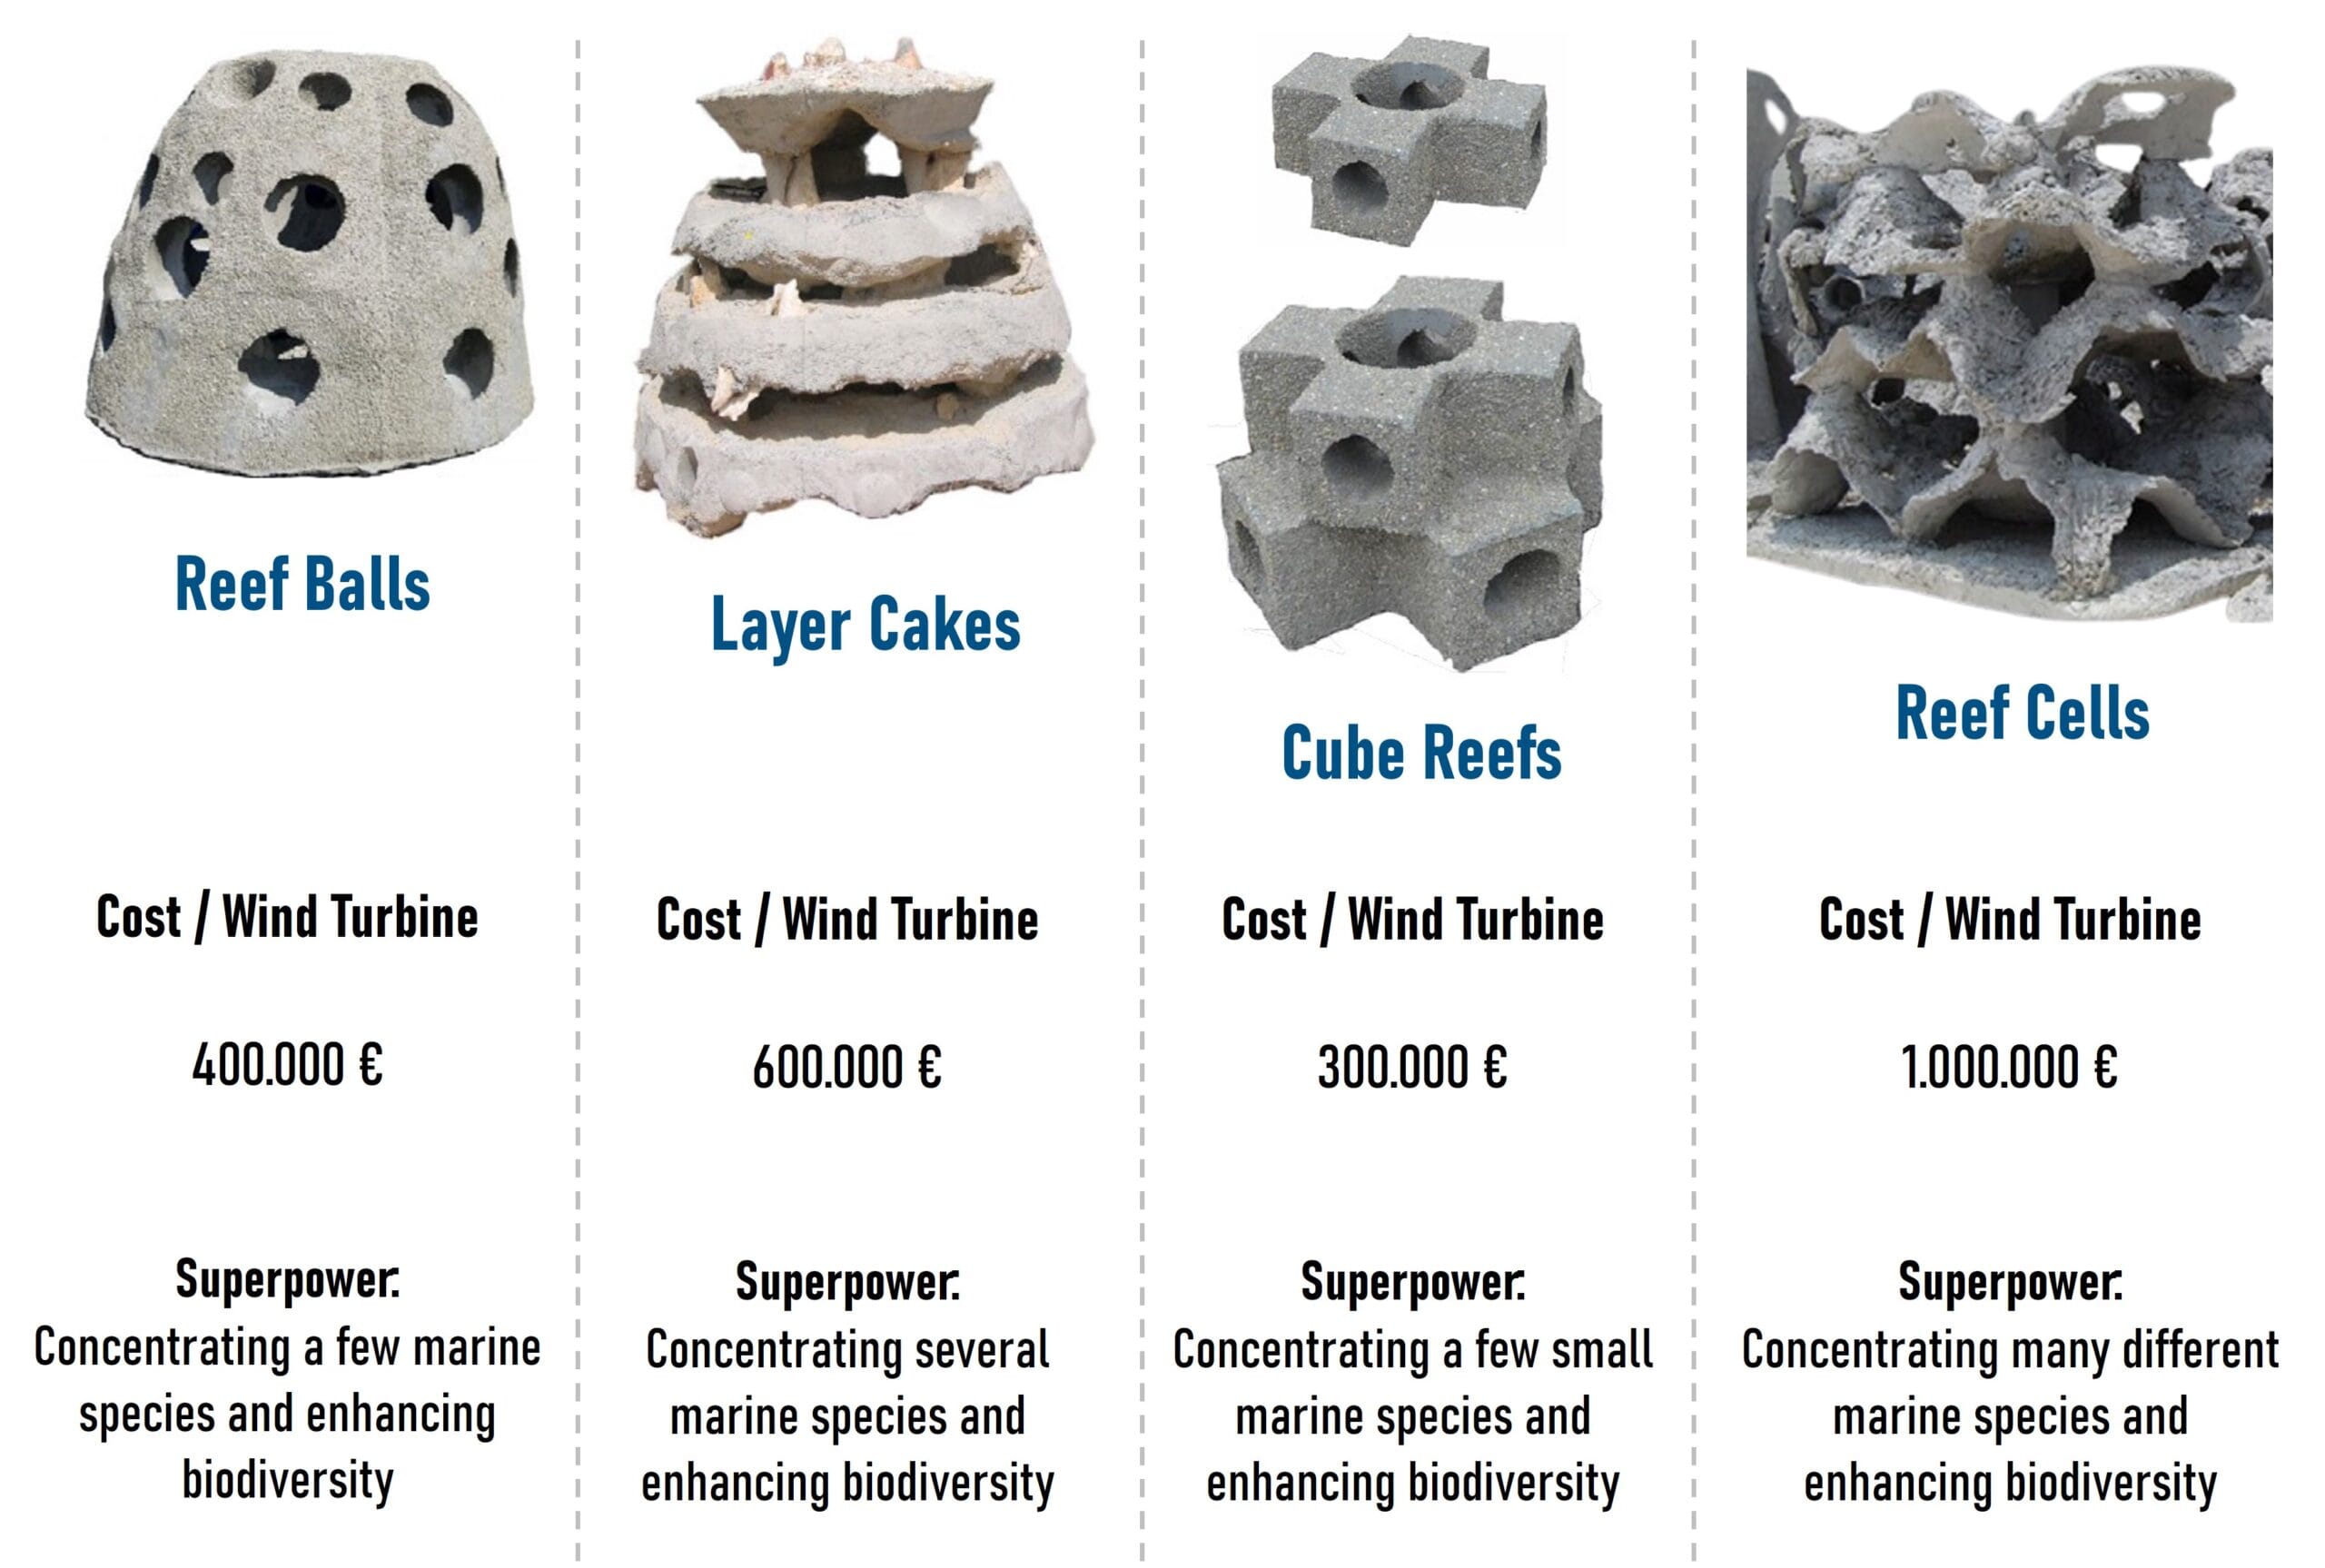
If the students select the Reef Cells, we need 40 of them for each one of the turbines which equals to a 40 million Euros cost! Next, we cover the cables with the fleximats which will cost 14 million Euros (140000 meters of cable length x 100). The ECOncrete concept is placed at the landing point of the offshore cable to land so, if we build a big one, it might costs 150 k Euros for 100 pieces!
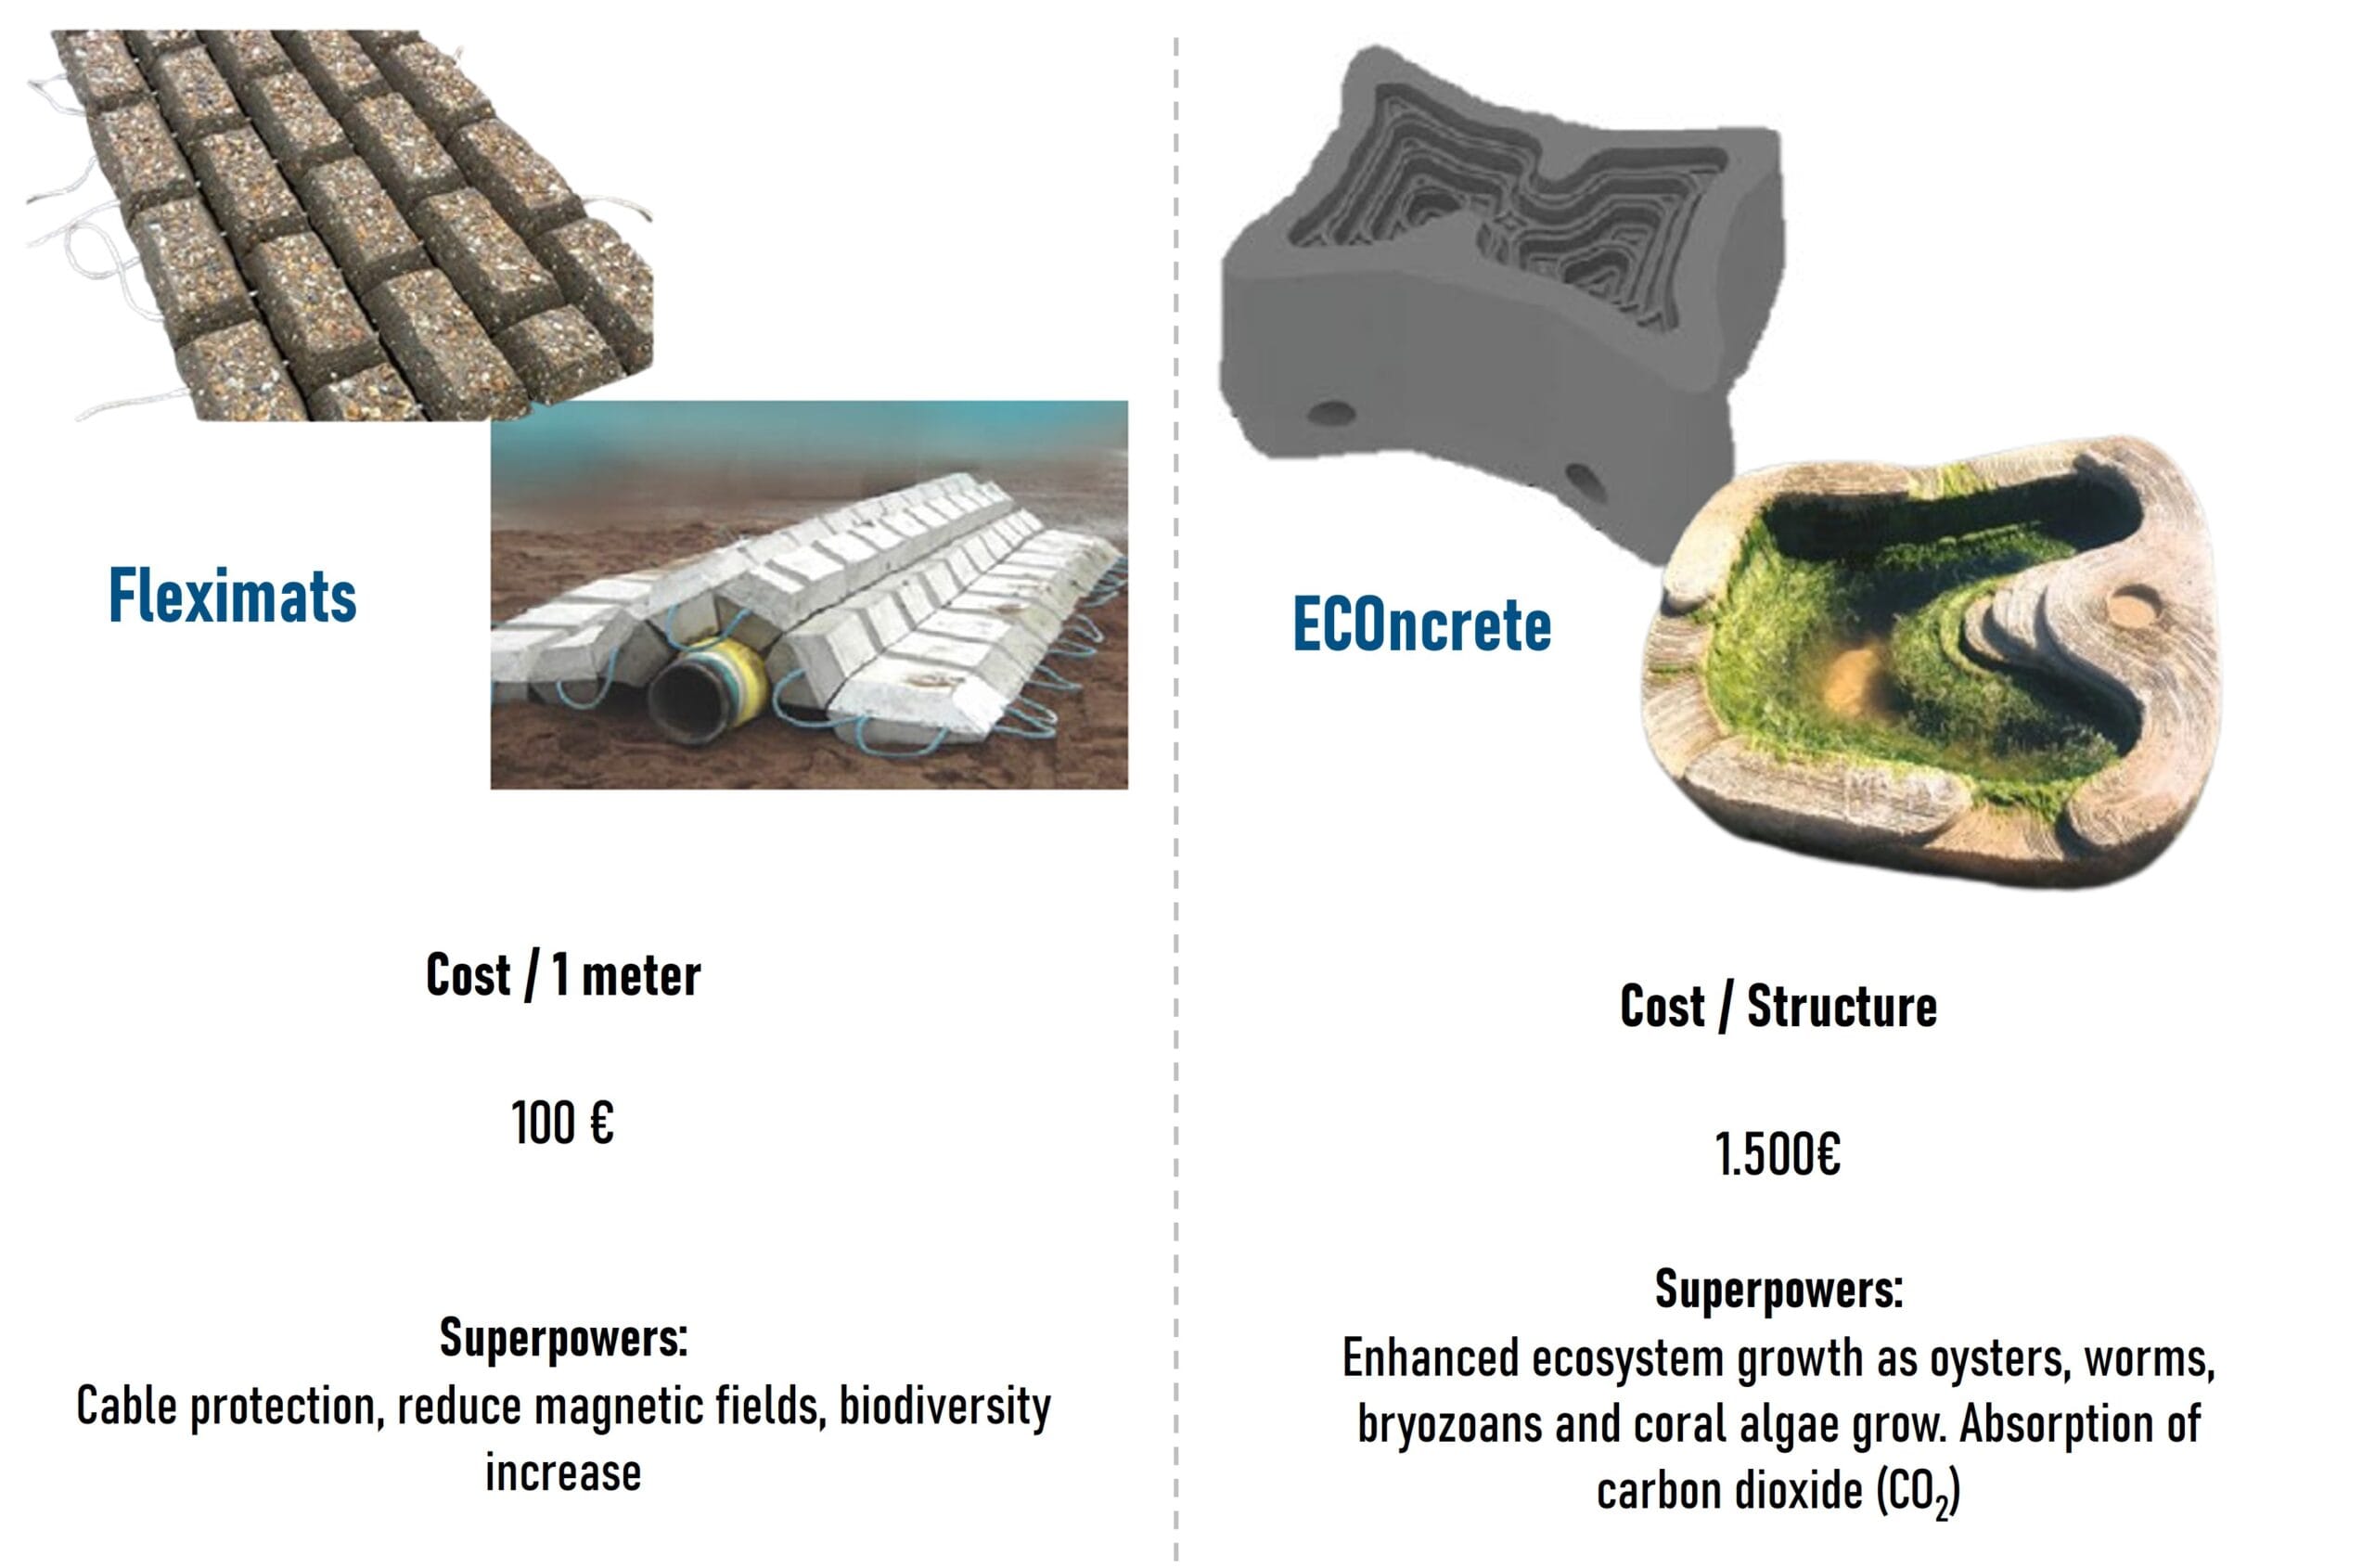
Consequently, our Offshore Wind Farm cost for 40 wind turbines will be approximately 750 million Euros! Let the students explore and find the number of wind turbines in different Offshore Wind Farm site worldwide and compare their costs with the actual costs!
Step 4: Results evaluation (with or without an expert) (45 – 70 minutes)
You may invite an energy expert to analyse students’ results. An easy way to validate and analyze our findings for Greece, is to identify actual areas for potential Offshore Wind Development! In the report of the Hellenic Hydrocarbons and Energy Resources Management in Greece [2], all areas of potential Offshore Wind Farm development are mapped.
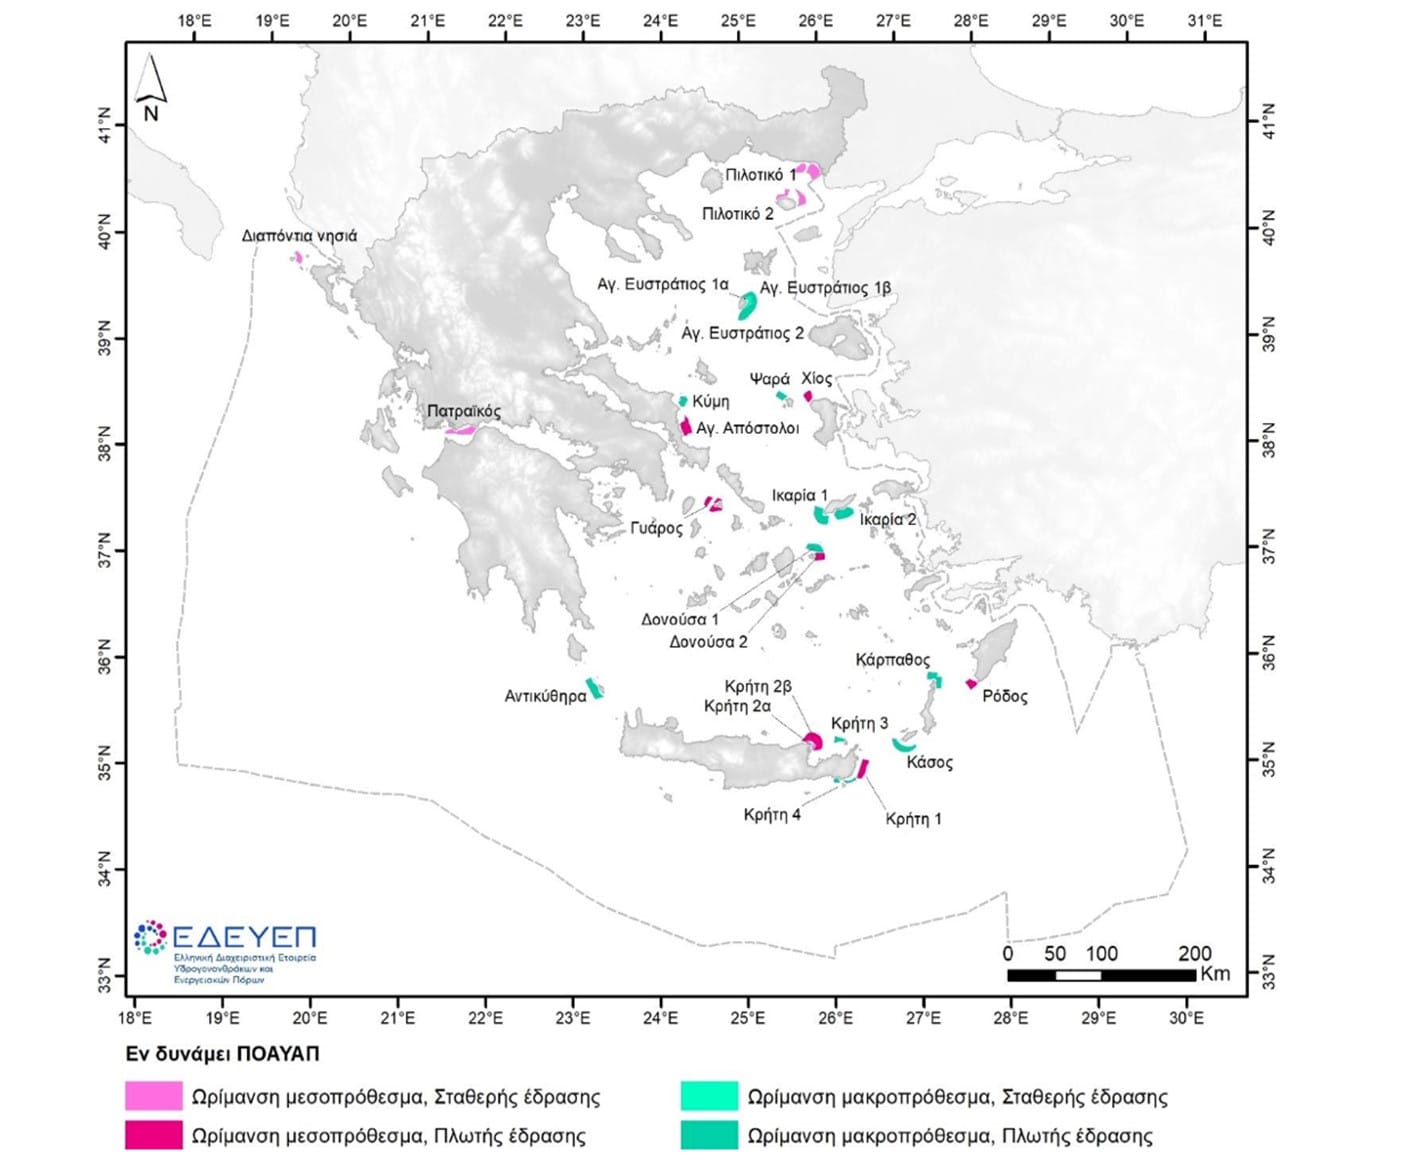
In the image above, 13 areas in the Aegean Sea are characterized as optimal for future Offshore Wind Energy deployment! Let your students compare their results and celebrate if they found any of those areas!
💡 Adaptability of the Activity for Other Renewable Energy Sources
This hands-on activity is designed with flexibility in mind. While the current focus is on Offshore Wind Farms, the same methodology can be easily adapted to other renewable energy technologies—such as solar parks, biomass facilities, or even onshore wind farms. The key lies in adjusting the criteria and the printed maps provided to students. For example:
- For solar panel siting, maps could show solar irradiance, land use, proximity to roads or the grid, and shading from terrain or buildings.
- For biomass infrastructure, students could work with maps of forestry areas, agricultural zones, transport access, and proximity to energy users.
By tailoring the maps and decision cards to your topic of choice, this Living Lab approach can support project-based learning across a variety of energy and environmental planning scenarios, making it ideal for both primary and secondary education levels. 🌞🌿⚡
Let students explore, compare, and decide—just like real-world planners!
Useful links
- American Geoscience Institute: What are the advantages and disadvantages of offshore wind farms?
- EDEYEP: Natioanal Programme for Offshore Wind Development – Greece