Spatial data types in GIS
Introduction
In Geographic Information Systems (GIS), understanding the different types of spatial data is fundamental for effectively representing, analyzing, and interpreting the world around us. Spatial data refers to information about the location and shape of geographic features and the relationships between them. These data types are broadly categorized into two main forms: vector data and raster data.
✅ Vector data represents geographic features using points, lines, and polygons — ideal for discrete objects like roads, buildings, and administrative boundaries.
✅ Raster data is made up of grids or pixels, commonly used to represent continuous phenomena like elevation, temperature, or satellite imagery.
✅ You will learn how to distinguish between these data types and understand when and how to use each in different GIS tasks.
✅ You will also explore how vector and raster data are stored, processed, visualized, and analyzed in GIS platforms like QGIS.
By the end of this lesson, you’ll be able to choose the right data type depending on your project needs and spatial analysis goals.
In the GIS4School courses [1], GIS data models (or geospatial data models), are defined as a set of constructs and abstractions for describing and representing geographic entities in a digital system. Basically, GIS data models reshape these entities into discrete geographic objects (vector models) or continuous surfaces (raster models) and fit both numerical and/or textual attributes with coordinates into computer files. The structure of these models is independent of specific data items and, in most cases, of the particular GIS application that is used to manipulate them.
GIS data models are often interchangeable so that the same geographic entity or phenomenon may be represented by different models. As an example, topographic relief of mountains may be portrayed as a continuous surface or as a series of lines (discrete objects) representing contours of equal elevation. Conversions between models entail some costs both computationally and in data accuracy but GIS software provides functions to perform automatically such conversions.
The right data model to use strictly depends on the specific application. What is important to keep in mind is that there is no single data model that is best for all circumstances. Nowadays, GIS software is able to incorporate multiple data models and so can be applied to a wide range of different applications.
📡 Different spatial data types
As we mentioned, there are two different types of GIS data, vector data and raster data and each type of data has its format. Check the following videos to get an idea!
🌐 Vector Data
Vector data structures represent specific features on the Earth’s surface, and assign attributes to those features. Vectors are composed of discrete geometric locations (x, y values) known as vertices that define the shape of the spatial object. The organization of the vertices determines the type of vector that we are working with is a point, line or polygon (see the image below [2]).
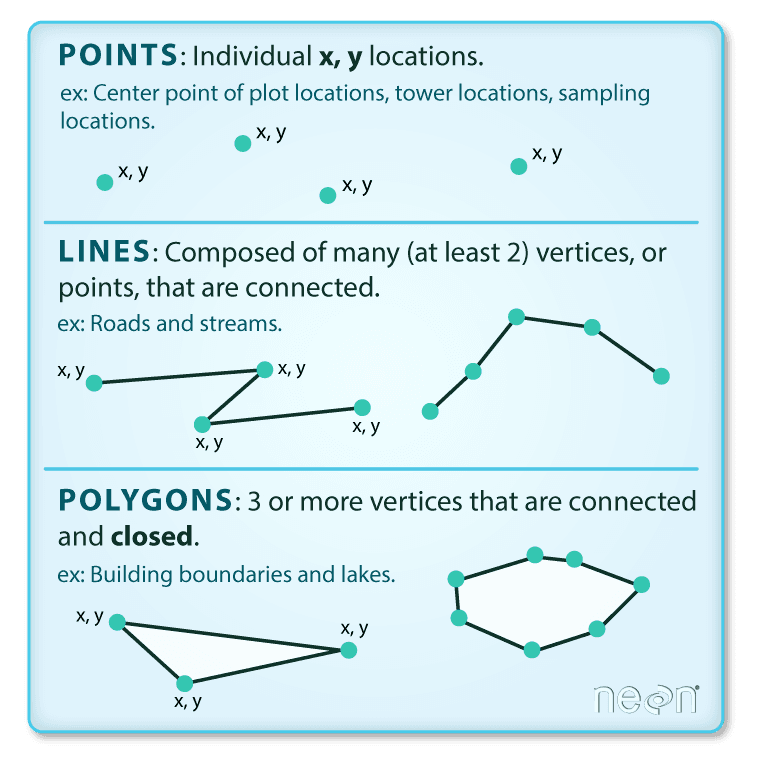 Image source: National Ecological Observatory Network (NEON)
All vector data can be represented as:
- Points: Each point is defined by a single x, y coordinate. There can be many points in a vector point file. Examples of point data include: sampling locations, the location of individual trees, or the location of cities (depending on the scale of a map).
- Lines: Lines are composed of many (at least 2) points that are connected. For instance, a road or a river stream may be represented by a line. This line is composed of a series of segments, each “bend” in the road or river stream represents a vertex that has defined x, y location.
- Polygons: A polygon consists of 3 or more vertices that are connected and closed. The outlines of survey plot boundaries, lakes, oceans, and states or countries are often represented by polygons. However, depending on the scale, if we ‘zoom-in’ a lot, we may represent rivers as polygons instead of lines since the water volume of a river stream covers a specific area (i.e. river width of 5 or 10 meters)
Vector datasets are used in many industries besides geospatial fields. For example, computer graphics are largely vector-based, although the data structures in use tend to join points using arcs and complex curves rather than straight lines. Computer-Aided Design (CAD) for example, is also vector- based software for engineers. The difference is that geospatial datasets are accompanied by information tying their features to real-world locations (coordinates).
✅❌Vector data advantages and disadvantages
Key advantages of vector data include:
- Features are more detailed & accurate
- The geometry contains information about what the dataset creator thought was important
- The geometry structures hold information in themselves – why choose point over polygon, for instance?
- Excellent representation of networks (i.e. in Open Street Maps)
- Each geometry feature can carry multiple attributes instead of just one, e.g. a database of cities can have attributes for name, country, population, etc.
- Data storage (file size) can be very efficient compared to rasters
Key disadvantages of vector data include:
- potential loss of detail compared to raster
- potential bias in datasets – what didn’t get recorded?
- Calculations involving multiple vector layers need to do math on the geometry as well as the attributes, so can be slow compared to raster math.
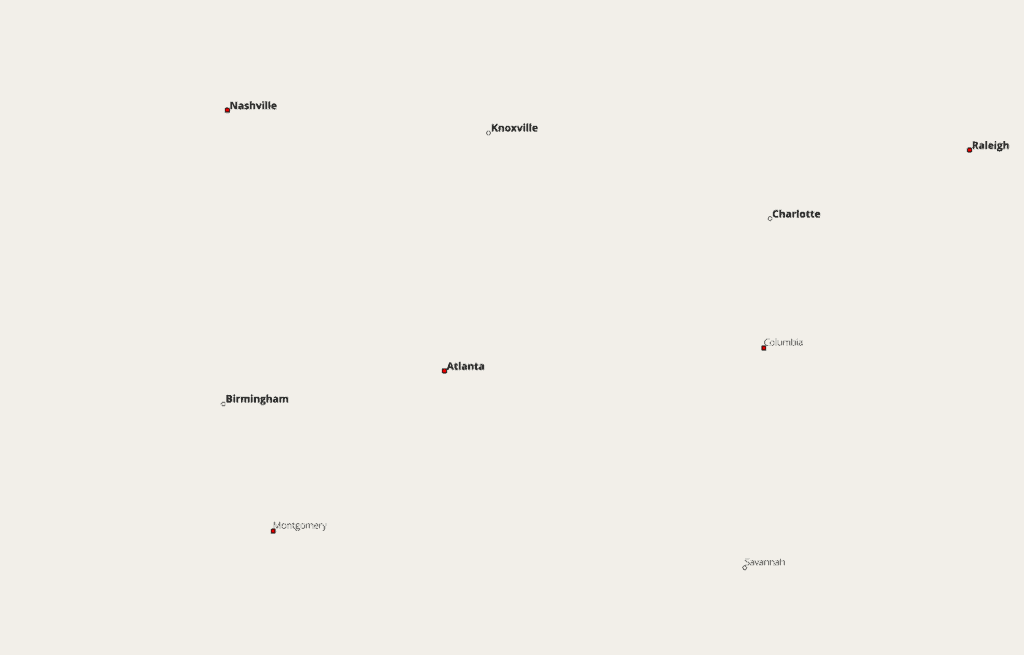
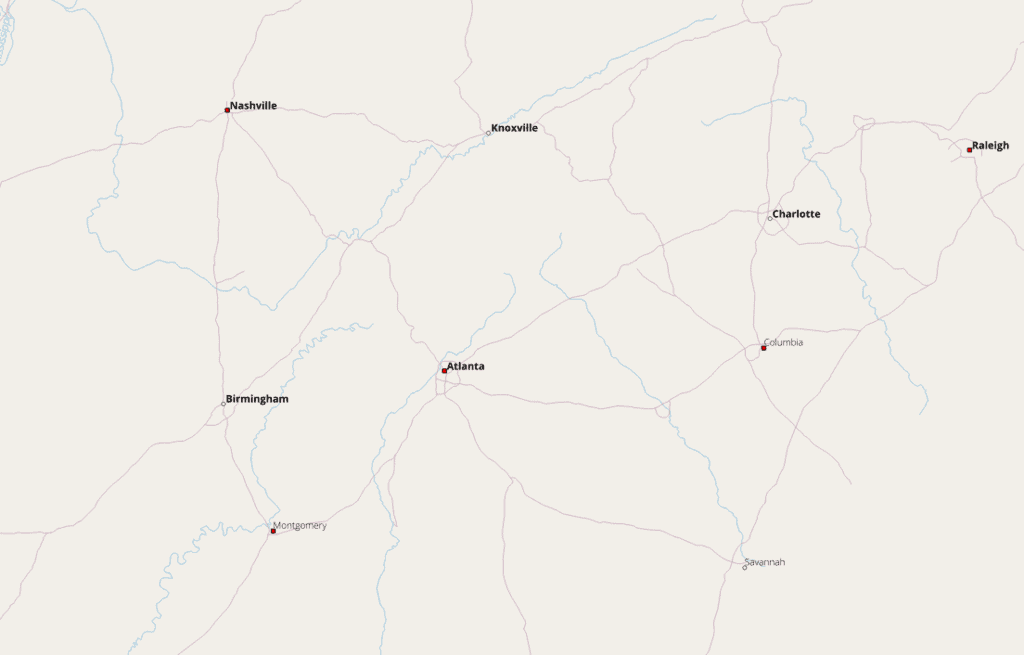
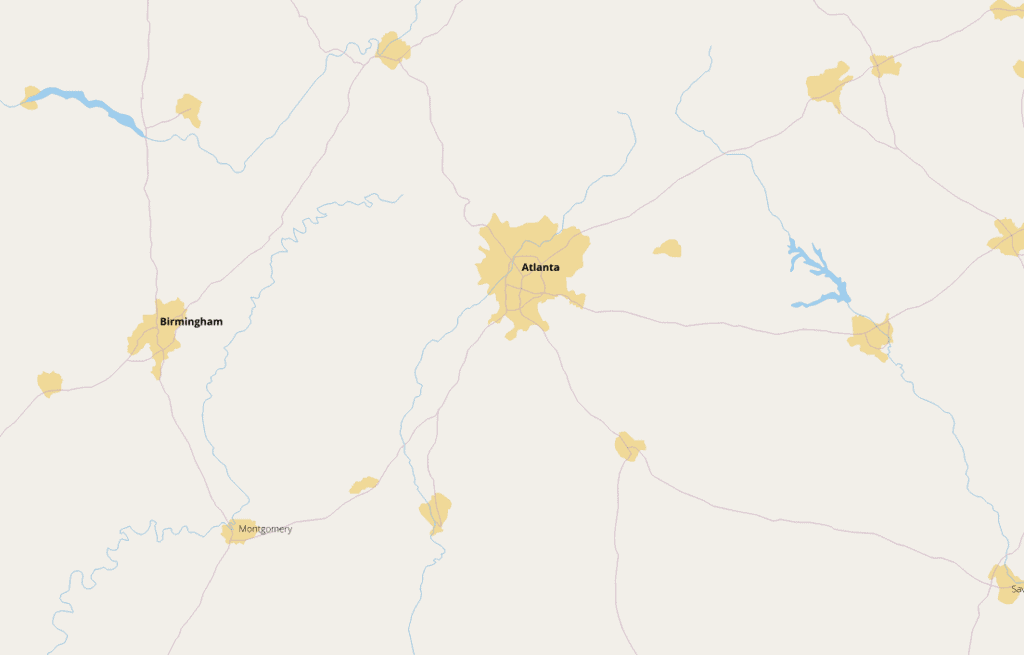
Images of vector data on a map (Image source: Geography Realm)
Points: Image 1, Lines and Points: Image 2 and Lines and Polygons: Image 3
🌍 Raster Data
Raster data refers to any grid-based or pixelated dataset in which each pixel corresponds to a specific geographic location. These pixels can hold continuous values (such as elevation or temperature) or categorical values (such as land cover types or land use classes).
Raster data shares the same structure as a digital image that we use on our daily life (i.e. TV or mobile screen, photos etc.). The key difference between a standard image (i.e. .jpeg, .png or other formats) and a geospatial raster is the presence of spatial reference information (coordinates or more accurately, the Coordinate Reference System – CRS). This metadata connects the image to a real-world location and includes details such as the raster’s extent, cell size, number of rows and columns, and the coordinate reference system (CRS). These components allow GIS software to accurately place and analyze raster data within a geographic context [1,2]. Important Attributes of Raster Data include:
- Extent (North, West, South, East): The spatial extent is the geographic area that the raster data covers. The spatial extent of a spatial object represents the geographic edge or location that is the furthest north, south, east and west. In other words, extent represents the overall geographic coverage of the spatial object. See the grey rectangle of the image below.
- Rows and Columns: In raster data, the number of rows and columns define the dimensions of the grid-like structure.
- Resolution (cell/pixel size): A resolution of a raster represents the area on the ground that each pixel of the raster covers. The image below illustrates the effect of changes in resolution. See the different pixel colours of the image below.
- Raster Data Format (type): Raster data can come in many different formats including .tiff images, .grd (grid) images, .img (image file) or more complex types like Network Common Data Form (NetCDF), HDF5 or GeoZarr which are file formats and a set of software libraries used for storing and sharing scientific data, particularly multidimensional data. NetCDF is widely used in fields like meteorology, oceanography, and climate science, where it is used to store and access data like temperature, pressure, wind speed, and other variables over time and space .
- Coordinate Reference System (CRS) – we will introduce the CRS explanation in the upcoming lessons: A framework used to define locations on Earth’s surface or in a plane.
- Values that represent missing data (
NoDataValue): Cell values can be either positive or negative, integer, or floating point. Cells can also have a NoData value to represent the absence of data. Sometimes there are homogeneous areas in a raster dataset that the you do not want to display. These can include borders, backgrounds, or other data considered to not have valid values. Sometimes these are expressed as NoData values, although other times they may have real values. See they grey areas of the image below.
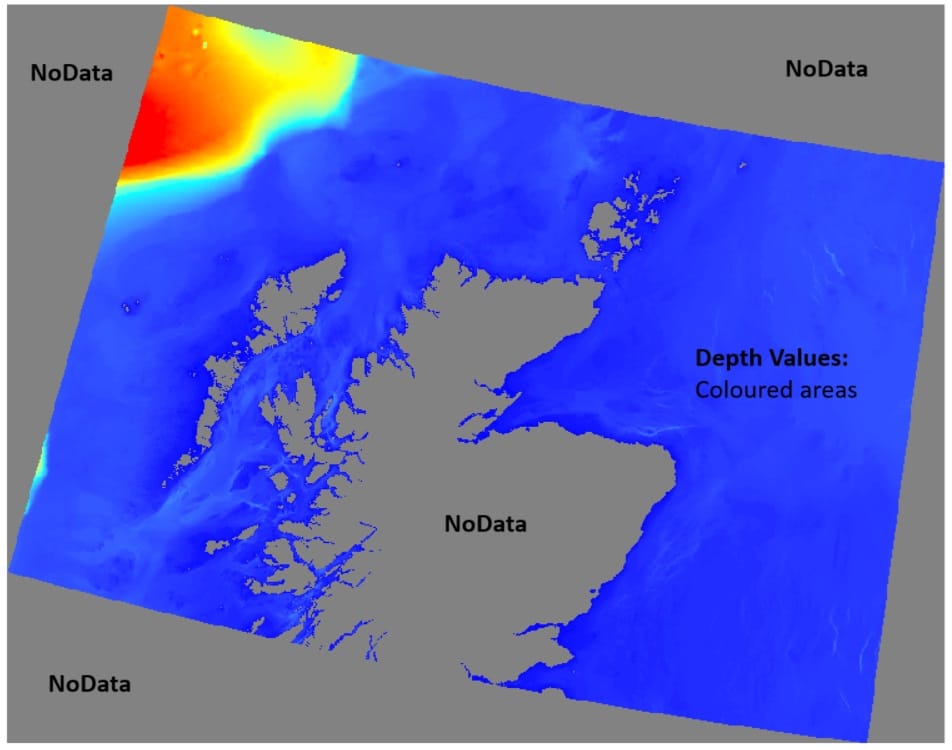
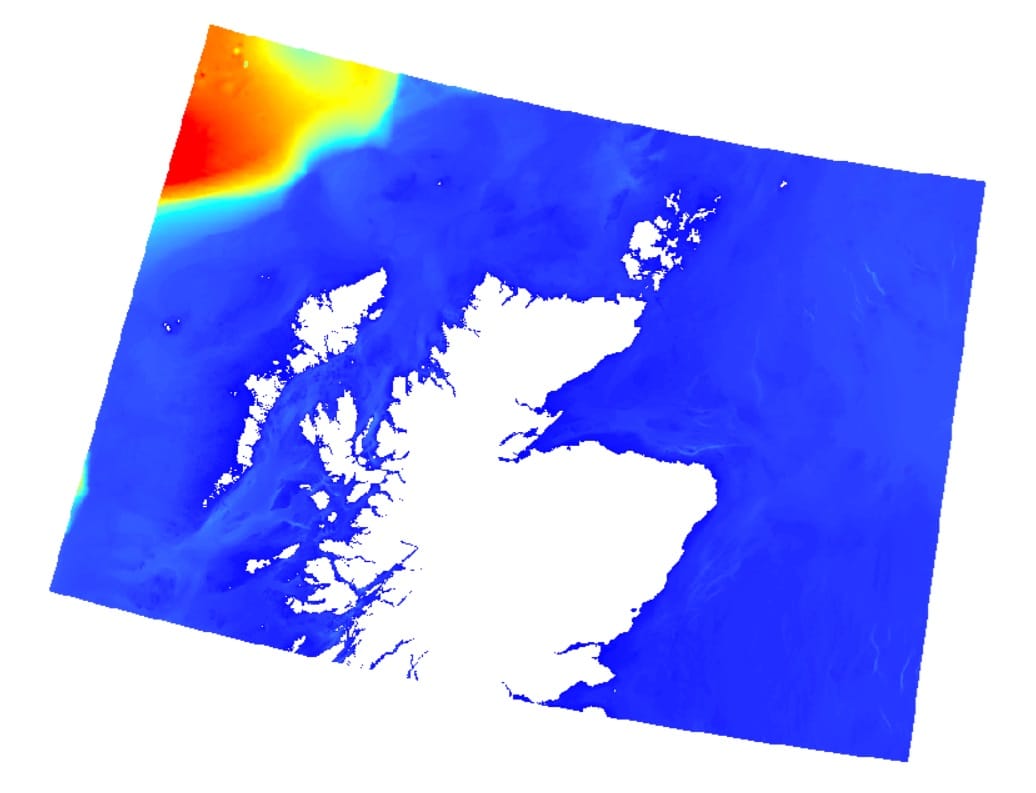
The image above depicts how a raster file will look like if we load it on a GIS platform or more precisely, what type of information GIS platforms use to load a raster image. To do that, all GIS platforms use the ‘Extent’ of the area/image (i.e. the number of rows and columns), the cell size (either in meters or degrees, depending on the Coordinate Reference System – CRS), the CRS and the X,Y origin (either the bottom or top left corner). When we load a raster file, NoData values will not be displayed and our data will be masked like is shown in the image below.
This image below provides a clear and intuitive explanation of raster data, for example, of an aerial map or satellite image from Google Earth:
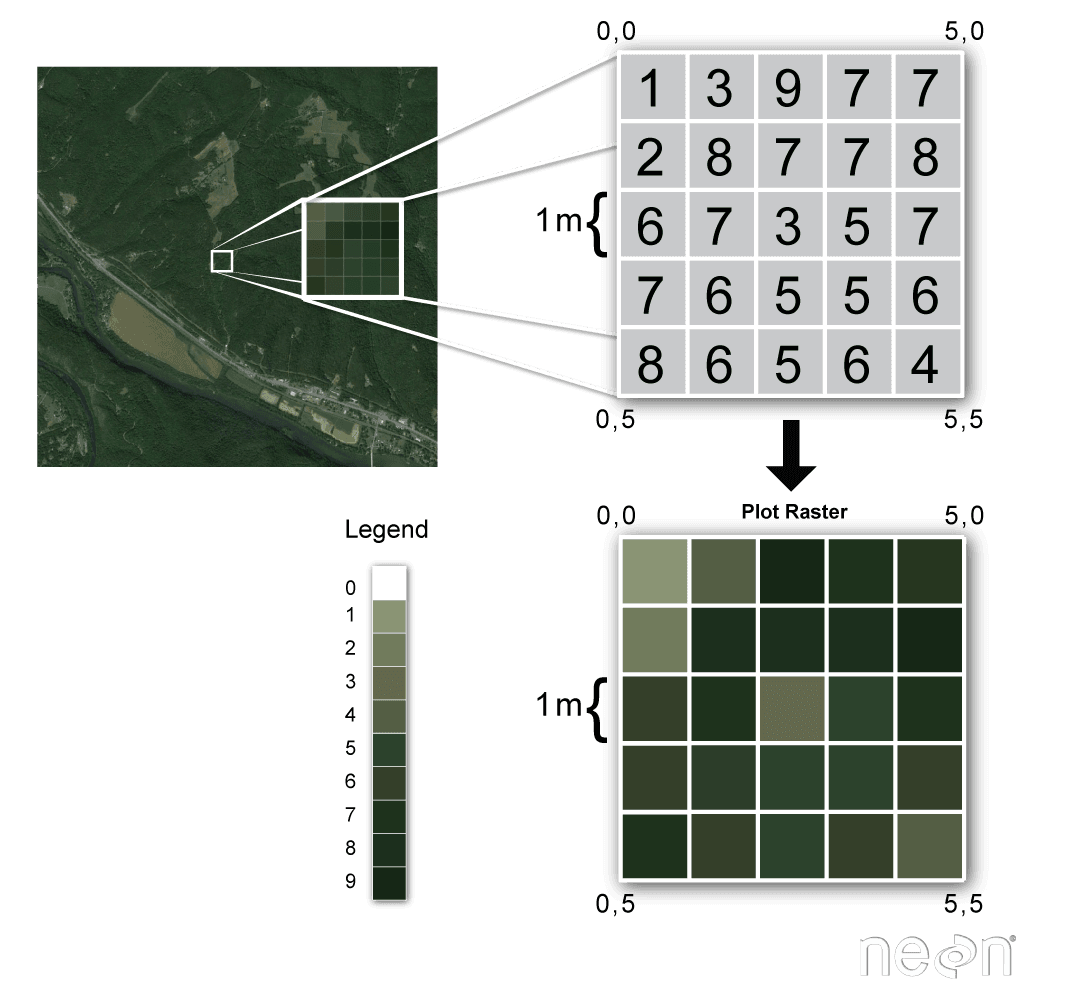
Image Source: National Ecological Observatory Network (NEON)
Raster data consists of a grid of equally sized cells (or pixels), where each cell holds a numerical value representing an attribute of the landscape, such as elevation, vegetation density, or temperature. In the image above, a satellite photograph is zoomed into a small section, revealing a 5×5 matrix of values ranging from 1 to 9 to highlight how images are structure in pixels. These values could correspond to environmental variables, such as vegetation index (e.g., NDVI), with each number indicating the condition or intensity of the measured variable at that location. The numeric values we observe are visually translated into a color-coded raster map using a defined color ramp, allowing users to interpret spatial patterns at a glance. Lighter shades typically represent lower values, while darker shades indicate higher values. This process of rasterization is essential for analyzing continuous spatial phenomena and supports a wide range of geospatial applications, from environmental monitoring and land-use classification to urban planning and resource management.
Other raster data/maps can be seen below:
- Landcover raster data and maps
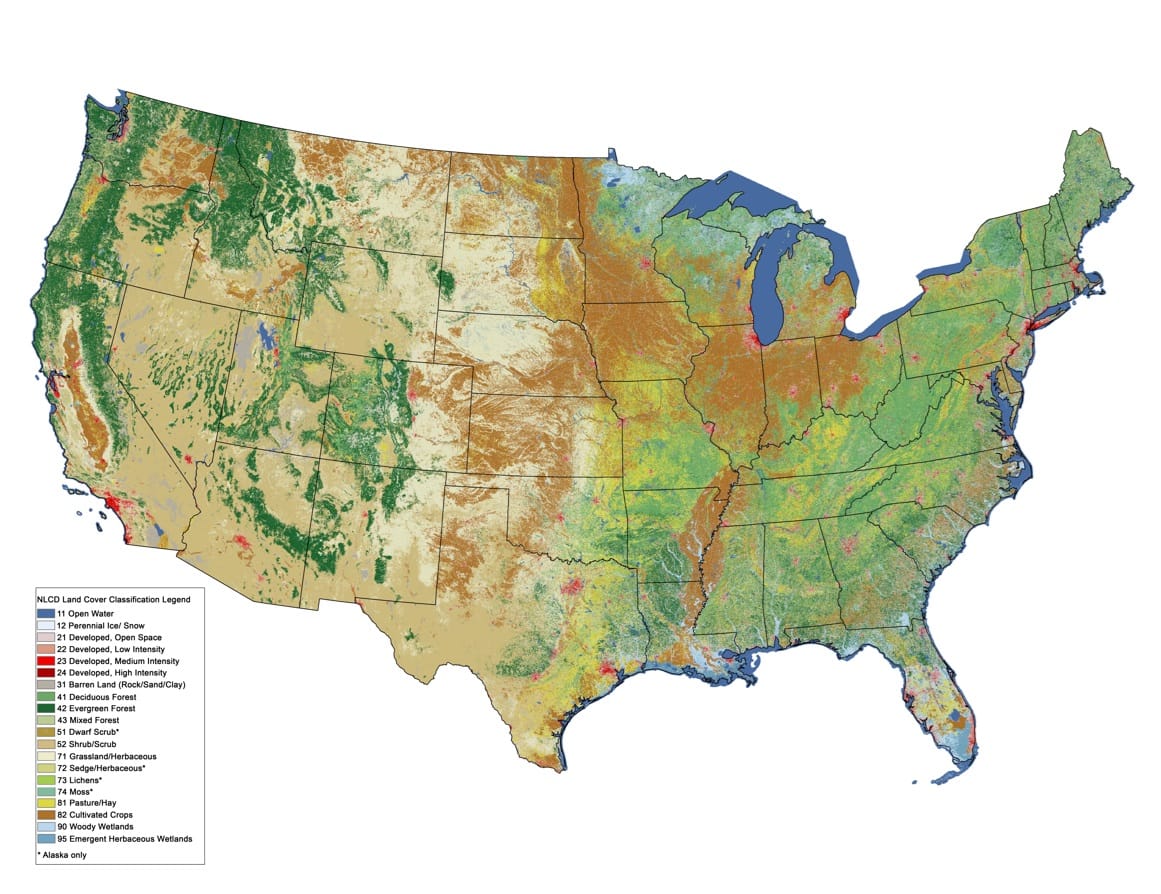
Image source: Homer, C.G., et al., 2015, Completion of the 2011 National Land Cover Database for the conterminous United States-Representing a decade of land cover change information. Photogrammetric Engineering and Remote Sensing, v. 81, no. 5, p. 345-354
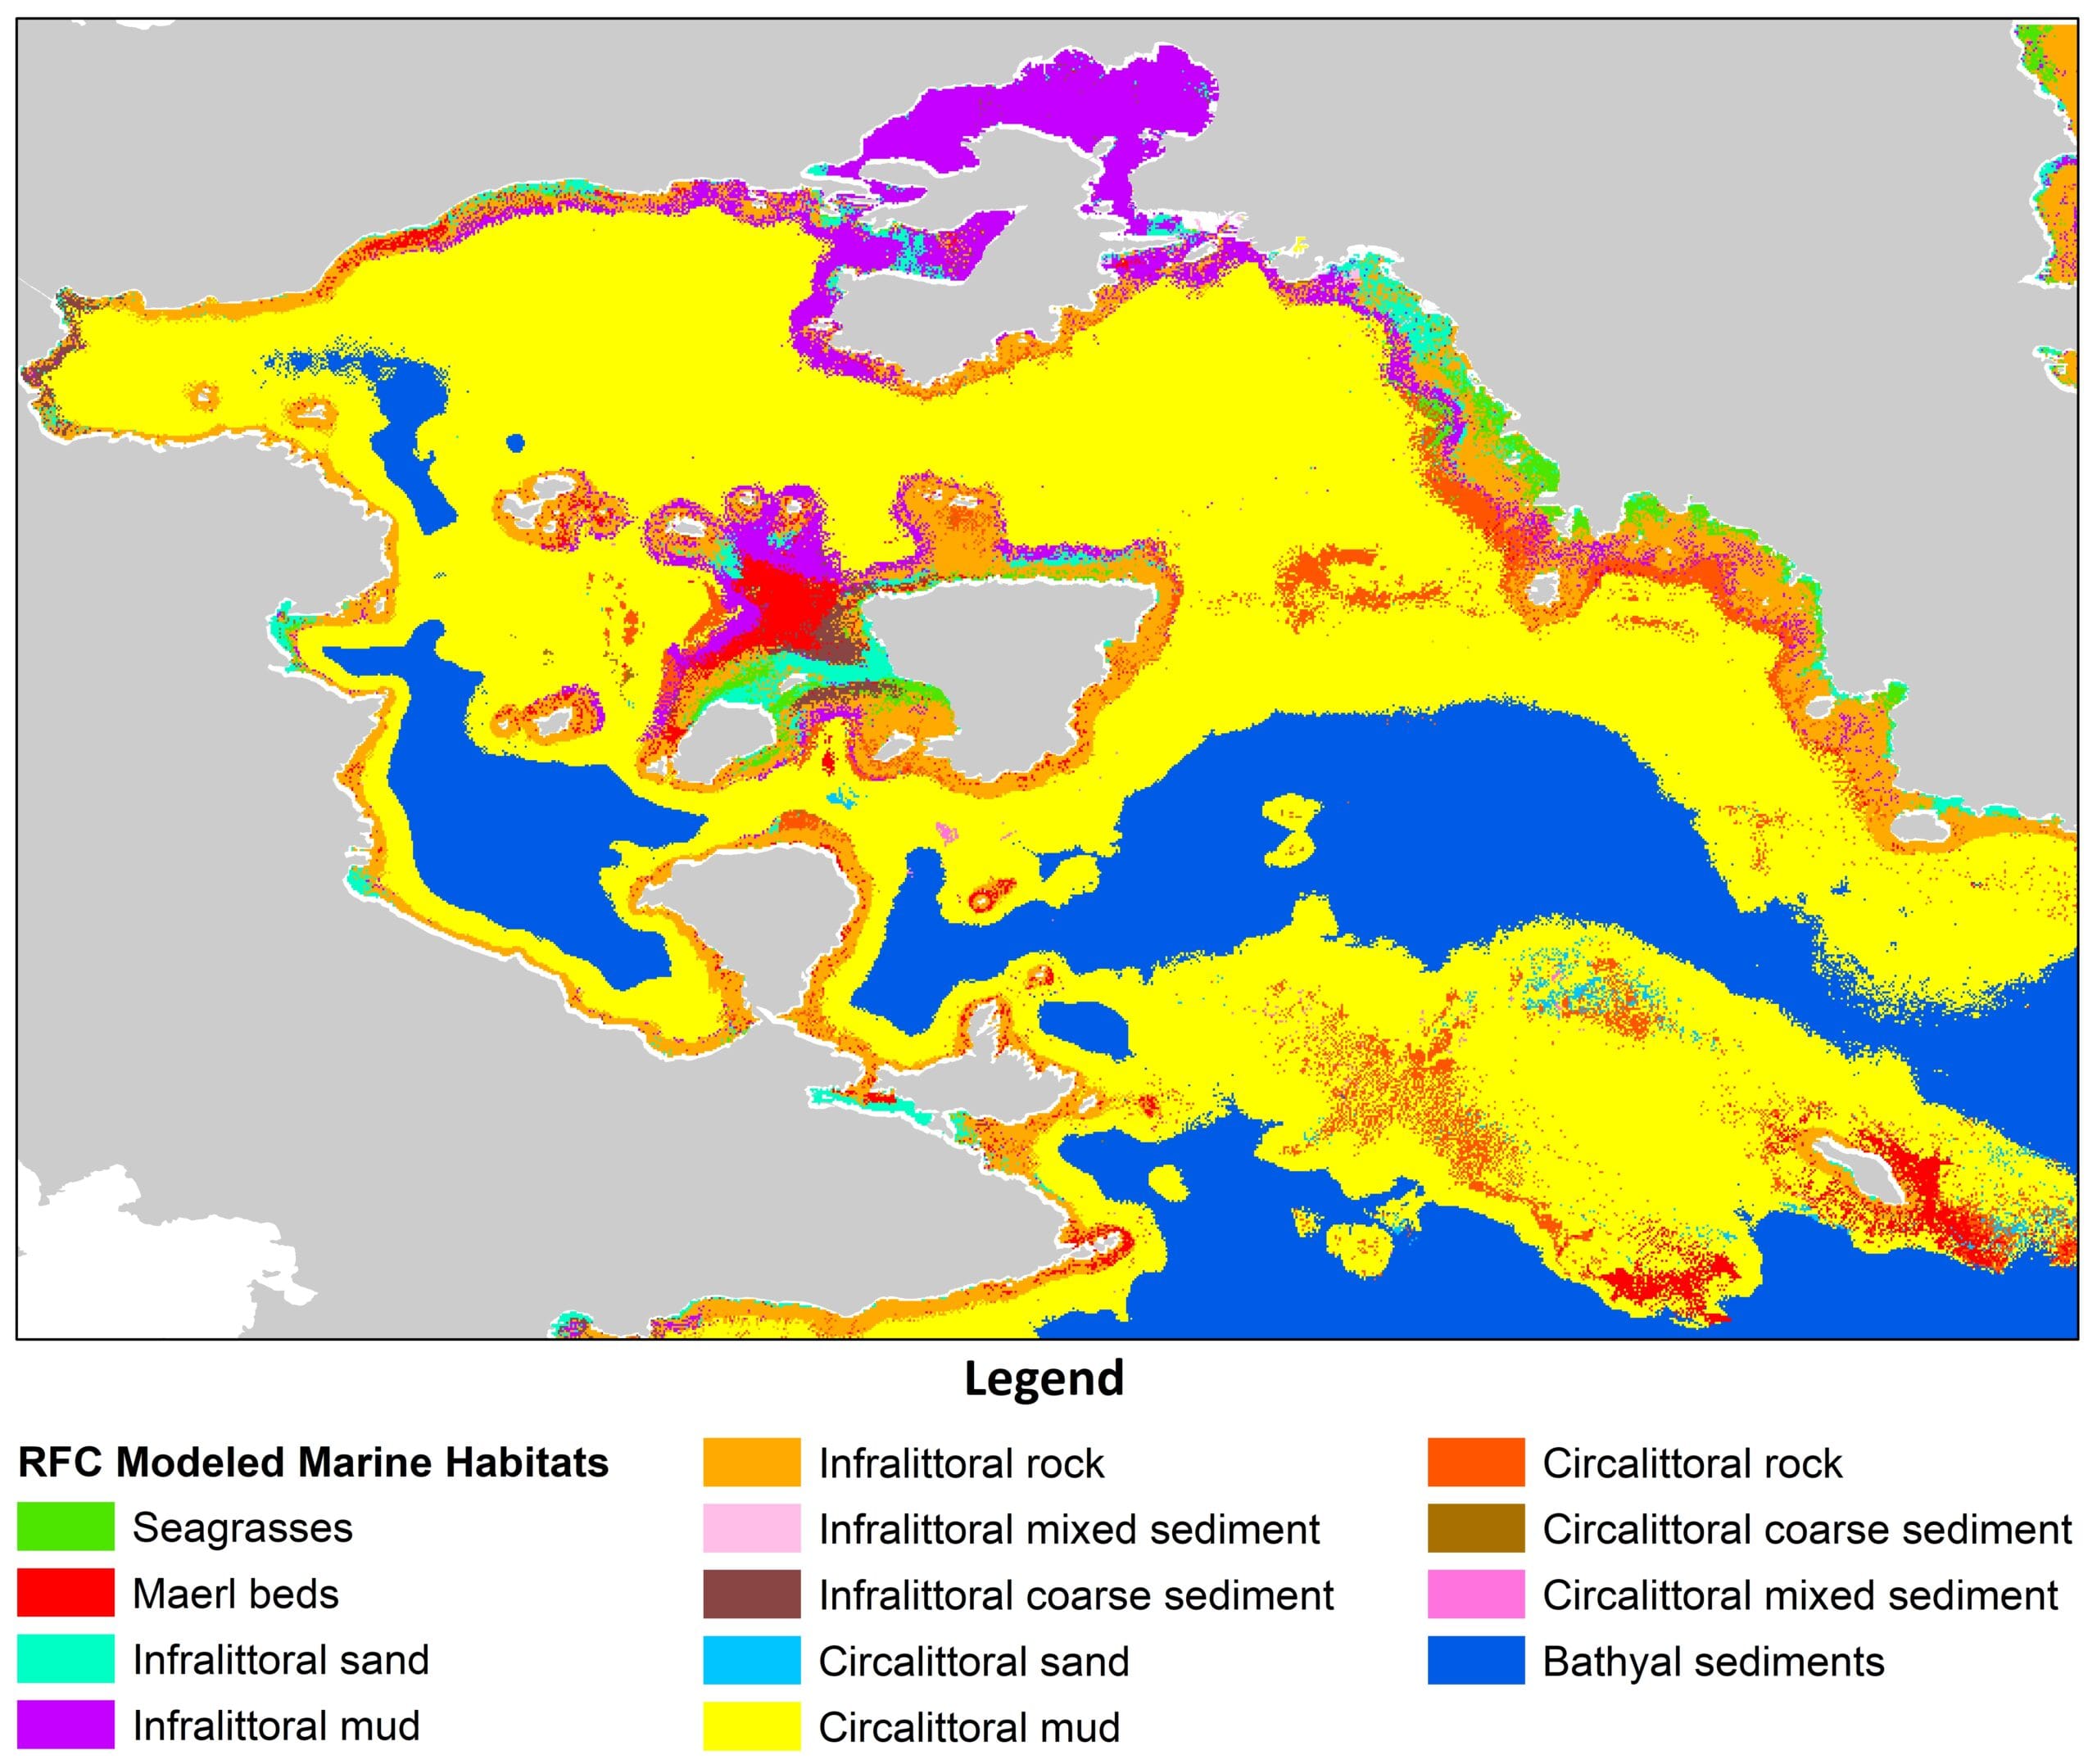
- Marine habitats maps:
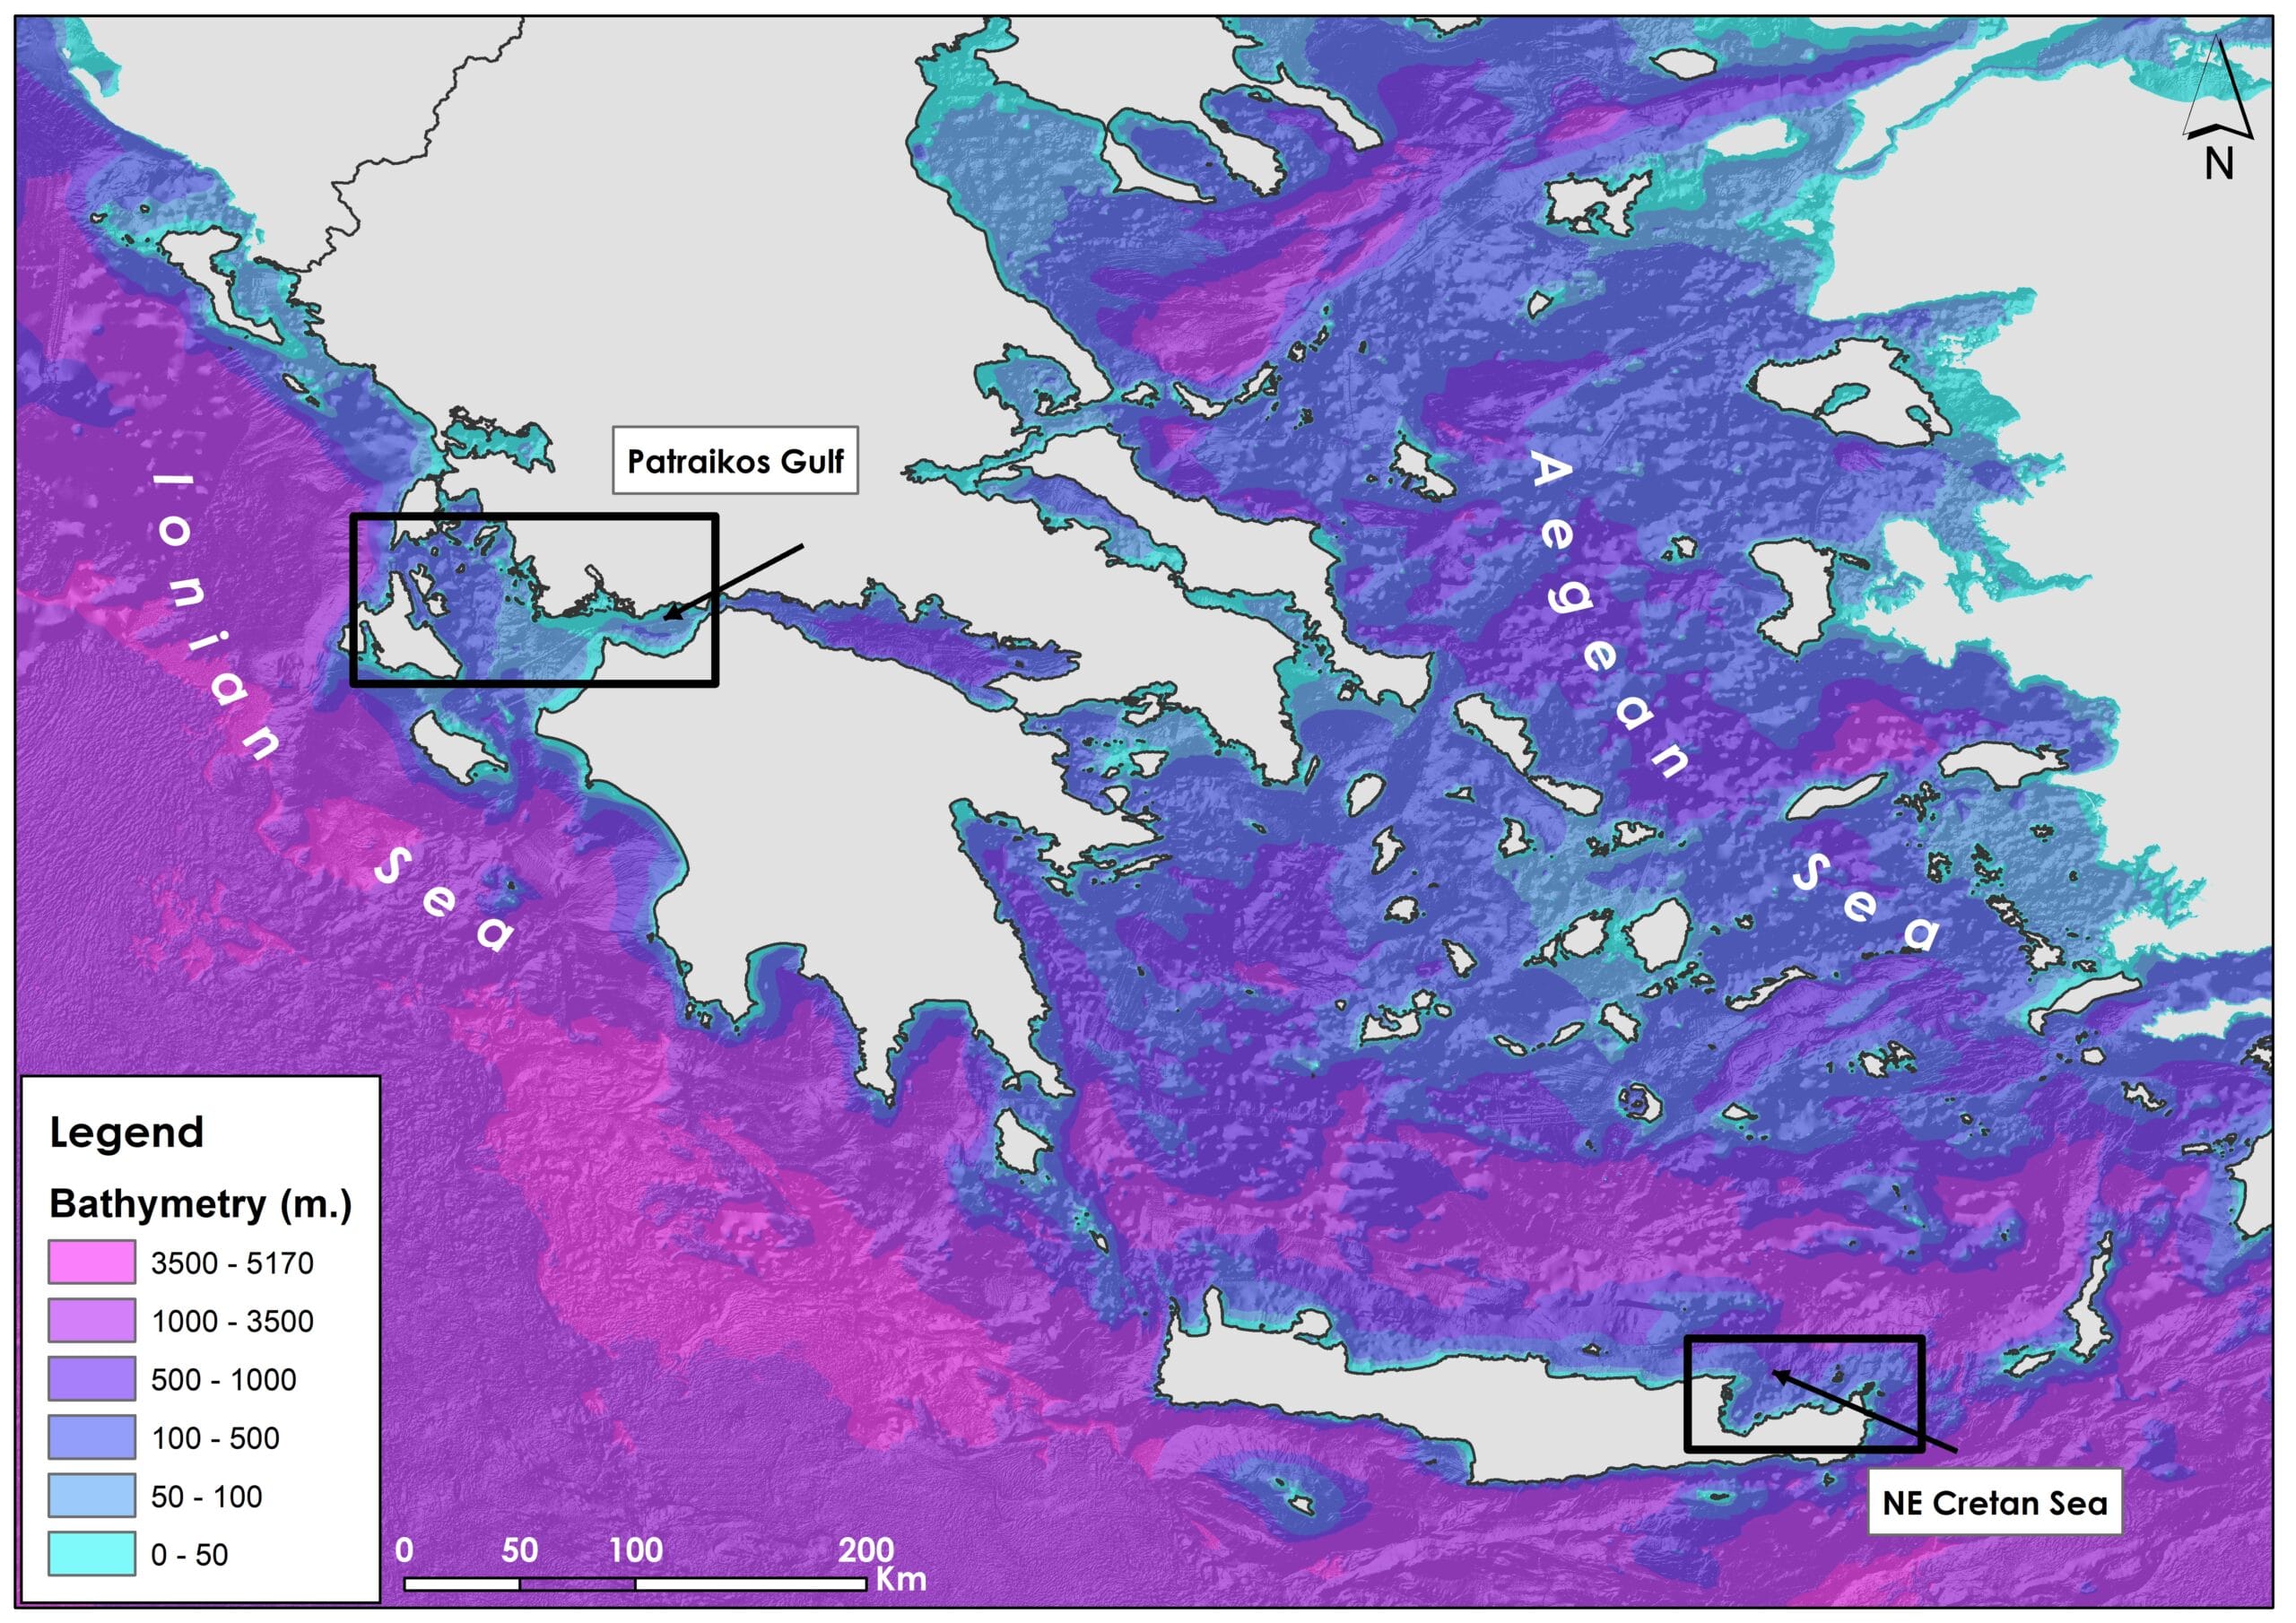
- Bathymetric maps:
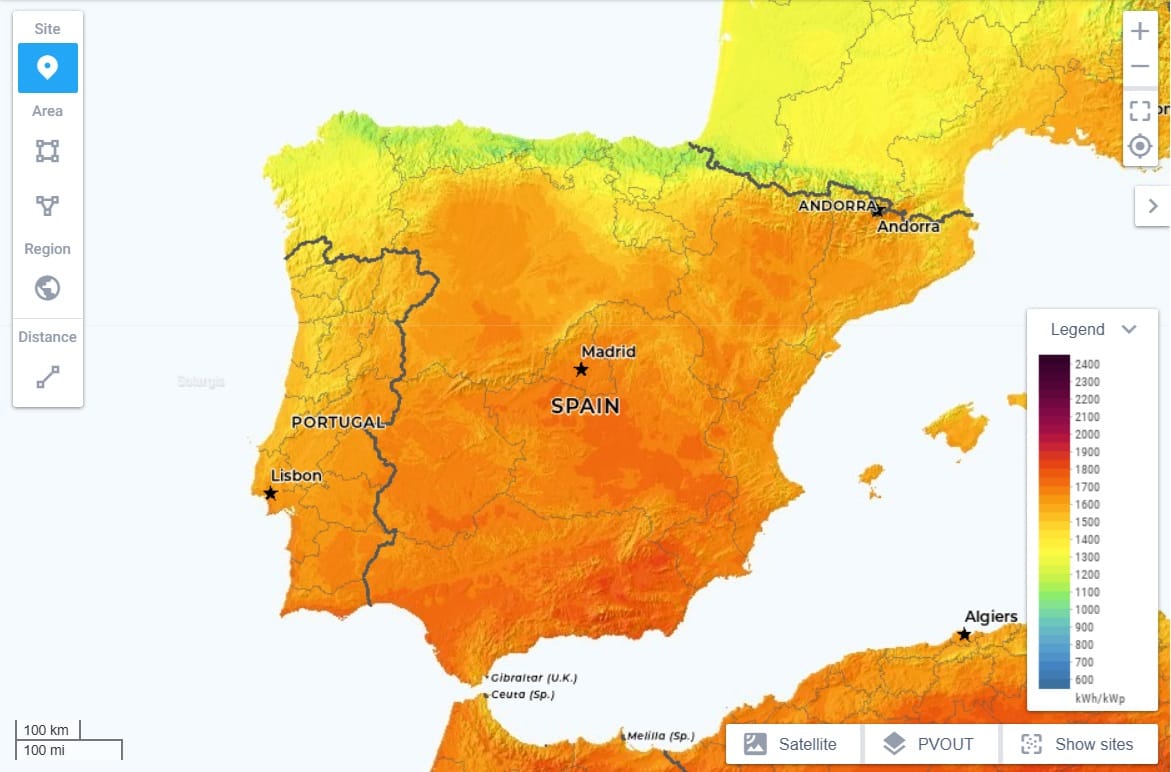
- Solar irradiation maps:
The impact of resolution (cell size)
A resolution of a raster represents the area on the ground that each pixel of the raster covers. The image below illustrates the effect of changes in resolution.
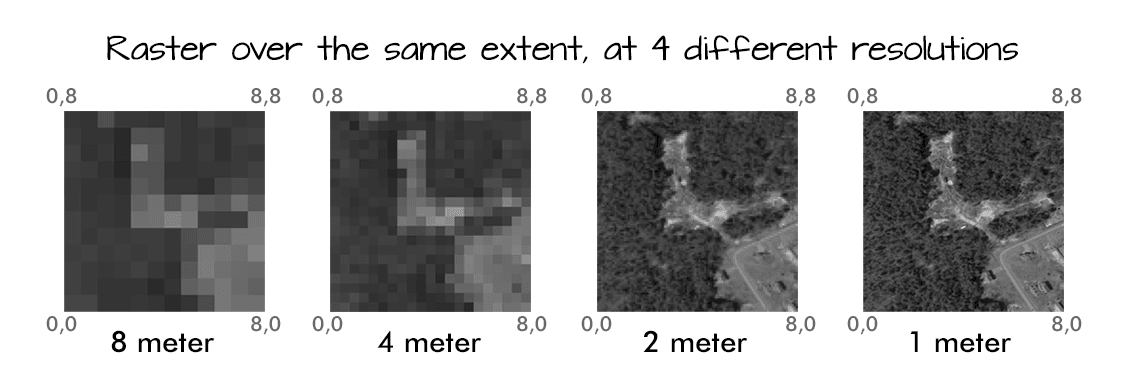
Image Source: National Ecological Observatory Network (NEON)
Multi-band Raster Data
A raster can contain one or more bands. One type of multi-band raster dataset that is familiar to many of us is a color image. A basic color image consists of three bands: red, green, and blue. In particular, each color (red, green, and blue) can have an intensity value ranging from 0 to 255, with 0 representing complete darkness and 255 representing maximum brightness (16,581,375 combinations!!). Each band represents light reflected from the red, green or blue portions of the electromagnetic spectrum (it’s all about physics). The pixel brightness for each band, when composited creates the colors that we see in an image. Hence, multi-band raster data in satellite images refers to a dataset where each individual raster band represents a different wavelength (or spectral band) of the electromagnetic spectrum [3,4].
These bands, when combined, provide a richer understanding of the Earth’s surface (see the image below) and can be used for various applications like vegetation analysis, land use mapping, and environmental studies.
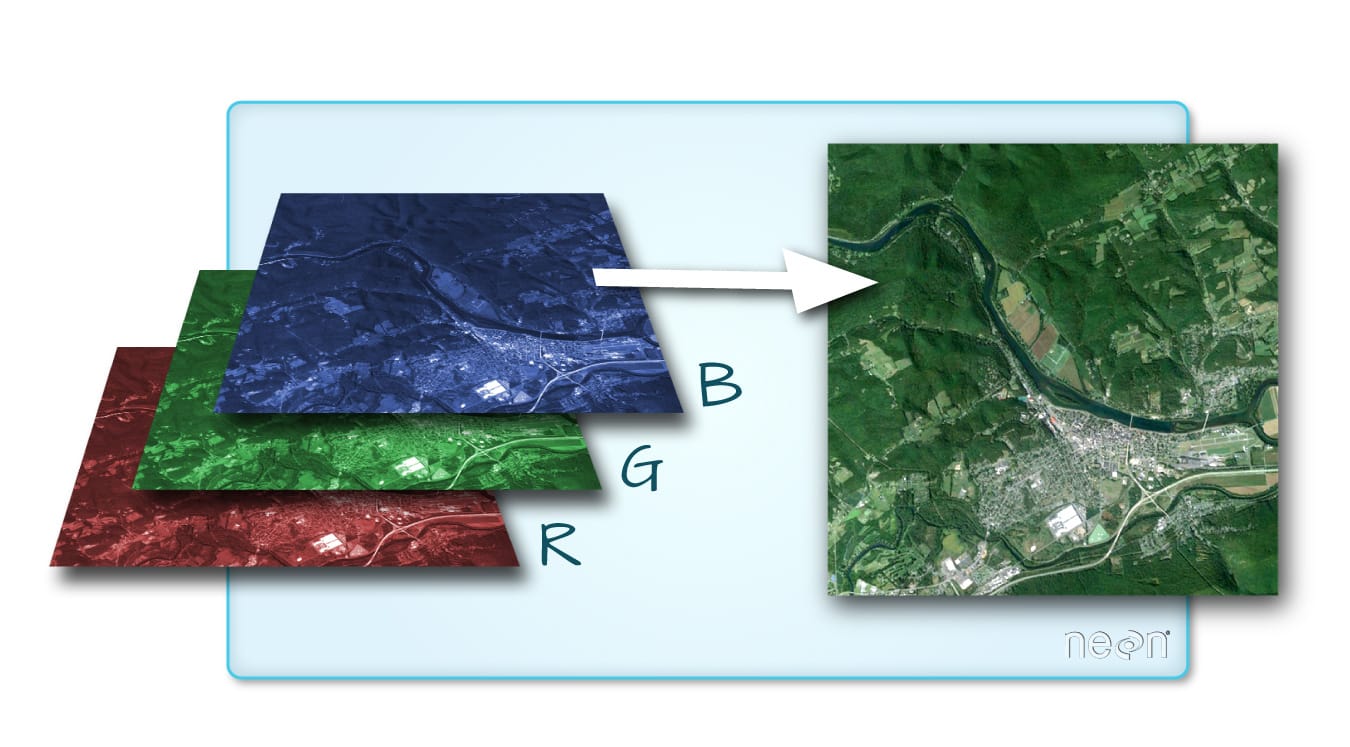
Image Source: National Ecological Observatory Network (NEON)
🛰️ Beyond Visible Light: Multispectral and Hyperspectral Data: While RGB images utilize the visible spectrum, many remote sensing applications require data beyond what the human eye can perceive [5]:
- Multispectral Imagery: Includes a few (typically 3 to 15) discrete bands, such as near-infrared (NIR) or shortwave infrared (SWIR), in addition to visible bands. This allows for analysis of vegetation health, water quality, and more.
- Hyperspectral Imagery: Captures data across hundreds of contiguous spectral bands, providing detailed information about material properties and enabling precise classification tasks.
These advanced datasets are essential for applications like agriculture monitoring, mineral exploration, and environmental assessment.
✅❌Raster data advantages and disadvantages
Key advantages of raster data include:
- Excellent for representing data containing continuous values (like weather, elevation etc.)
- Potentially very high levels of detail (i.e. when the cell size is small, 1,2 or 5 meters)
- Data is ‘unweighted’ across its extent – the geometry doesn’t implicitly highlight features
- Cell-by-cell calculations can be very fast and efficient, however, it always depends on the size of the image
- Simulations and modeling is easier (spatial analysis, terrain modeling etc.).
Key disadvantages of raster data include:
- File size is larger than vector data.
- Only one pixel value represents each grid cell.
- Can be difficult to represent complex information
Industries That Use Vector and Raster GIS Data
GIS data and analysis is an integral part across numerous industries and sectors, utilizing both vector and raster data to analyze spatial information, make informed decisions, and optimize operations. Vector data—comprising points, lines, and polygons—effectively represents discrete features such as human infrastructure, boundaries, and networks. Raster data, consisting of pixelated grids, is ideal for continuous data like satellite imagery, elevation models, and weather maps. Industries such as urban planning, agriculture, environmental management, and public health leverage these data types to enhance their services and strategies. For instance, urban planners use vector data to design infrastructure layouts, while environmental agencies utilize raster data to monitor land cover changes. The synergy of vector and raster data in GIS enables a comprehensive understanding of spatial phenomena, facilitating efficient resource management and strategic planning across various sectors. Professionals in almmost any industry can benefit from GIS technology. Here are some of the most popular examples of industries that use GIS [6].
- Supply Chain – Tracking inventory shipments can make the supply chain more effective, thus saving businesses money.
- Insurance – Having the ability to accurately determine risk is vital for insurance companies. GIS can identify areas that are more likely to experience earthquakes, floods, or other natural disasters, as well as identify areas with higher crime rates.
- Forestry – GIS systems can collect data to help preserve ecosystems by identifying species in certain areas, changes in animal populations, and mapping out things like annual rainfall, temperatures, and the severity and length of dry seasons.
- Urban Planning – GIS helps planners better understand the needs of their city. It allows them to design the city to fill those needs in a way that will benefit its businesses and residents.
- Banking – Banks can use GIS to determine where their branches’ locations should be or what branches they should close to increase profitability. It can also help them decide what products are best suited for their demographics.
- Public Health – Public health offices can use GIS to identify areas at risk for certain diseases. Using this data, they can deploy awareness campaigns to help educate the citizens of a particular place at risk.
In the following lessons, we will delve into specific industries and we will solve real-world problems that harness the power of vector and raster GIS data, exploring how these tools contribute to their success and innovation!
Useful links
- GIS4Schools: GIS Data Modelling
- Geography Realm: Types of GIS Data Explored: Vector and Raster
- NEON: Introduction to geospatial concepts
- ESRI: Raster Bands
- ESRI: Create a multiband raster from individual bands of satellite imagery in ArcGIS Pro
- MGISS: The different types of spatial data