Skills: Digital
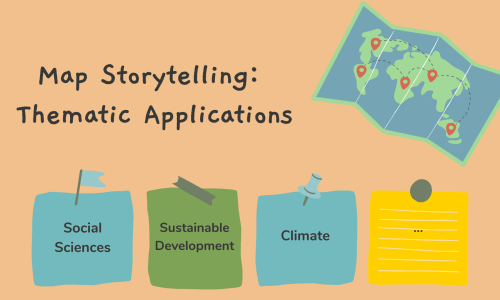
4. Map Storytelling: Examples and thematic applications for the classroom
Did you know that more than 80% of the information around us happens somewhere and answers the question “where”? That […]
Free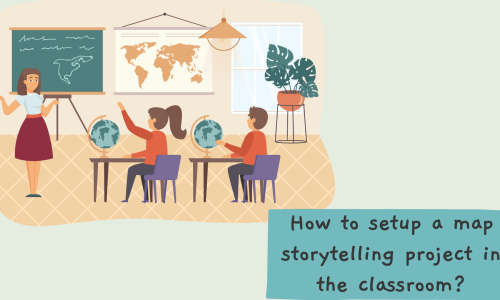
3. How to setup a Map Storytelling project in the classroom
Maps have always been more than navigation tools — they are windows into the world, carrying stories about people, places, […]
Free
Part 5: Cartography for people with visual impairments (VI)
According to the World Health Organization (WHO), at least 2.2 billion people, globally,have some kind of vision impairment (numbers refer […]
Free
Part 4: Development of Spatial Skills through Cartography and Maps
Watch the YouTube video Spatial Ability – Skill and Ability Video by CareerOneStop to get an idea what spatial ability […]
Free
Part 3: Map Literacy
Clarke (2003) defines functional map literacy as the ability to understand and use maps in daily life, for work and […]
Free
Part 2: Introduction to Thematic Mapping
The course guides you through the notions of thematic mapping and thematic maps, which are core building blocks of geovisualization. […]
Free
STEAM education, robotics, and coding – Part 2
Robotics components and systems In this sub-module, learners explore the core building blocks of robotics and how these essential parts […]
Free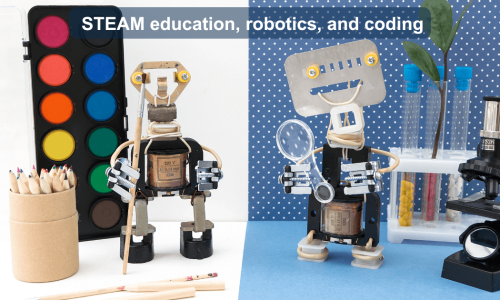
STEAM education, robotics, and coding – Part 1
Introduction to Robotics and STEAM In this sub-module, you will learn about the basics of robotics and how they intersect […]
Free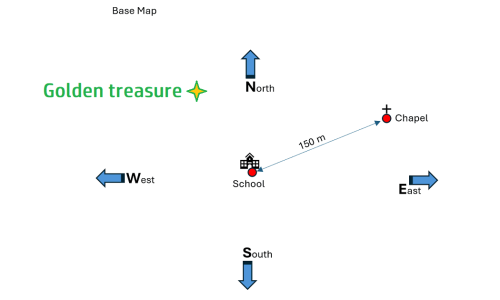
A plan for the primary level
The course presents a three-unit teaching sequence that engages students in hands-on activities to explore data acquisition, reference systems, and map layering. In the first unit, students use pedometers to measure their steps and calculate the average stride length by experimenting with different data collection methods, introducing them to concepts like mean value and unit conversion. The second unit focuses on spatial reference systems, where students measure the distance between their school and a nearby building, then create a base map marking key locations, distances, and compass directions. Building on this, the third unit has students add their home locations to the base map, layering individual data to create a collective city map that visualizes spatial relationships. Through these activities, students develop mathematical and geographical skills, learning to collect, analyze, and represent data in a meaningful way.
Free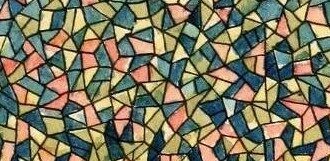
Part 1: Geovisualization and Cartography
This course comprises four sections: It starts with an introduction to the notion of geovisualization. Geovisualization refers to a set […]
Free
1. Introduction to Map Storytelling
Did you know that the way humans have understood and shared knowledge about the world around them has always involved […]
Free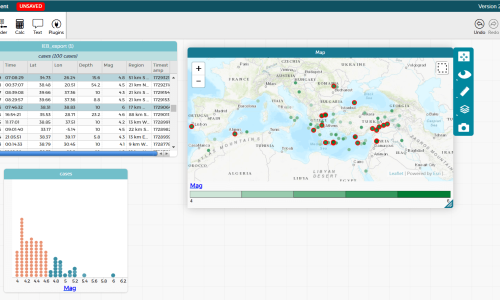
Insight into a heap of data
Of course, meanwhile you can find everything on the internet, but if – for example – the mean value (in […]
Free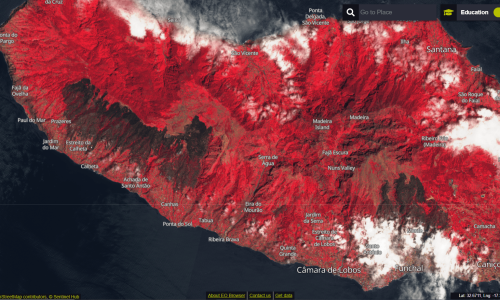
Sometimes seeing red is a good thing
The spectral analysis of a landscape using false colour representations and including the IR components in the light makes a […]
Free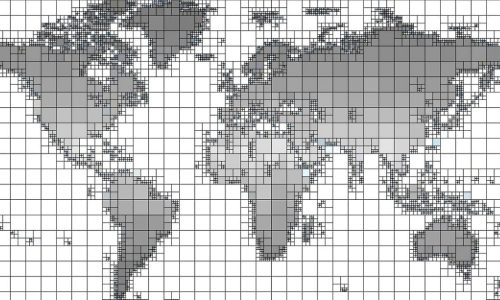
The numbers beneath the map
Digitalised maps often conceal a swarm of numbers that want to tell us something. Efficient work with maps therefore requires […]
Free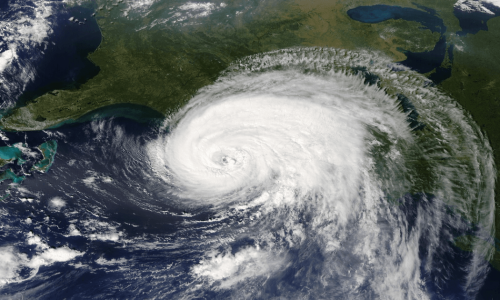
Our world from above
Student-friendly software solution for analysing satellite images The use of satellite images for monitoring, modelling and visualising environmental changes is […]
Free
The Gap and the Mind
FeaturedGapminder offers a wide range of options for visualising data about our planet and its countries. LINK: https://www.gapminder.org/tools/
Free